|
||||
| U.S. Geological Survey Open-File Report 02-372 |

Physical Properties of Long Island Sound Sediment Cores

Home Page Introduction Methods Data Discussion Bibliography Acknowledgments |
DiscussionNearly all the sediment introduced into Long Island Sound (LIS) since the last glacial maximum has remained in the Sound (Knebel and Poppe, 2000). Large rivers account for about half (51%) of the modern fine-grained sediment flux into LIS (Knebel and Poppe, 2000). The Connecticut River, the biggest river flowing into LIS, is the largest contributor of both freshwater and sediment into LIS (Knebel and Poppe, 2000). Other significant sources of modern fine-grained sediment input include: shoreline and bluff erosion, coastal streams, urban and cropland runoff, and sewage treatment plants (Knebel and Poppe, 2000). Since the last glacial maximum, the Connecticut River has contributed large quantities of sediment to the LIS basin. Deposits from glacial Lake Connecticut and the marine delta formed by the Connecticut River's drainage of glacial Lake Hitchcock have contributed about 44% of the total fine sediment in the LIS basin (Lewis and DiGiacomo-Cohen, 2000). Over the last 13.5ka, the regional sediment transportation regime has redistributed large volumes of the glacial-lacustrine sediments from the eastern to the central and western parts of LIS (Lewis and DiGiacomo-Cohen, 2000 and Poppe and others, 2002). A complex set of transport, deposition, and reworking processes act on LIS sediments before they are preserved in the sediment record. Knebel and others (1999) and Knebel and Poppe (2000) delineated environments dominated by four different sedimentary processes in LIS: fine-grained deposition (characterized by bottom sediments that are muds and muddy, fine sands), sediment sorting and reworking (characterized by heterogeneous sands and muds), coarse-grained bedload transport (characterized by coarse-to-fine sand with small amounts of mud), and erosion or non-deposition (where boulder fields to gravelly coarse-to-medium sands are present).
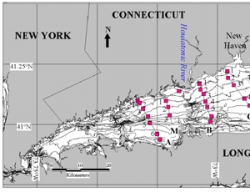
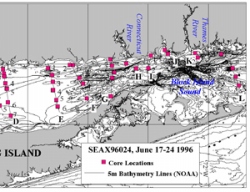
For a GIS coverage of these sedimentary environments and sample locations see the LIS section on the Woods Hole Science Center ArcIMS server. While the different environments exist in scattered patches across the basin, generally the sedimentary environments change from erosion or non-deposition in eastern LIS to fine-grained deposition in western LIS. This follows from the general westward transportation of sediment, a process dominated by tidal currents with wind-driven currents playing a lesser role (Signell and others, 2000). Surface sediments in regions of fine-grained deposition, which make up 41% of the LIS basin floor, (Knebel and Poppe, 2000) exhibit the highest concentrations of metals (Mecray and Buchholtz ten Brink, 2000) and the sewage indicator Clostridium perfringens (C. perf., Buchholtz ten Brink and others, 2000b) in LIS. Metals and C. perf. results from LIS cores indicate similar patterns. The x-radiographs, water content, and grain size data add a third dimension to the sedimentary environment characterization done by Knebel and others (1999) and Knebel and Poppe (2000). X-radiographs demonstrate where the current sedimentary environment extends back in time and the few places where the environment may have changed (discussed below). The three parameters add much helpful information for understanding LIS below the surface and through recent geologic time with sediment in some cores able to be dated at several hundreds of years old. X-radiographs of these cores were used to outline the sedimentary structures present within the deposits. The x-radiographs also allowed investigators to see fine sedimentary structures such as cross-bedding and laminations, which were often not captured in the core cutting process (done at 0.5 cm intervals for most cores). When multiple cores were taken at a station, x-radiographs provided useful information for choosing which of the replicate cores to cut. (See Methods Section for discussion of criteria used to choose cores for sectioning.) When sectioning the cores in the laboratory, the cutting intervals were occasionally adjusted to sample interesting features seen in the x-radiographs. Strong correlations exist between both water content and the fine fraction (silt + clay) [Plot 1] and between sedimentary environment and the water content and fine fraction [Plot 3]. The water content and fine fraction fall along a line with R2 = 0.87 [Plot 1]. If the cores from the three transects outside LIS proper (the J, K, and L transects) are excluded, R2 = 0.91 [Plot 2]. This correlation can allow for an estimation of the fine fraction for the 26 cores with water content data but no grain size data. Cores were retrieved from each of the sedimentary environments of LIS. Core D7C4, from the central basin, is the best example of a core from a fine-grained depositional environment. The grain size contains more than 95% fine-grained sediment and the water content decreases from about 70% at the top to 50% at the bottom. In contrast, H2C1 (see also the similar I2C1) from eastern LIS is mostly sand and gravel with greater than 35% gravel at some intervals in the core, and the water content is 5% at the top and 19% at the bottom of the core. The low values at the top most likely result from the core draining while in storage and during the cutting process. The low values at the top most likely result from the core draining while in storage and during the cutting process. Evidence for the depositional environment can be seen in the D7C4 Cs-137 peak, which is among the sharpest peaks found in the LIS cores collected. The sedimentation rates calculated from the Cs-137 peak and from the metals peak were 0.77 cm/year and 0.88 cm/year, respectively. The rates calculated from the Cs-137 onset and excess Pb-210 were significantly higher (1.14 cm/year and 1.72 cm/year, respectively). The higher Cs-137 and Pb-210 rates may result from background not being reached for Cs-137 or Pb-210, i.e., the onset for Cs-137 and the background value for Pb-210 were below the deepest sample in the D7C4 core. Though the D7C4 Cs-137 peak is quite sharp, the Cs-137 values above 13 cm do not drop, which gives evidence for mixing processes being important, at least in the upper part of the core. Nonetheless, the Cs-137 peak and metals data do seem to adequate to make a good estimate of recent sedimentation rates at the D7C4 site. The low Cs-137 and Pb-210 values at 45.25 cm give evidence for horizontal transportation of older sediment with no Cs-137 indicating that the sediment was older than 1954 and low Pb-210 values indicating the Pb-210 had decayed to background values. The x-radiograph, water content data, and grain size data remain nearly constant at the bottom of the core meaning that the low Cs-137 and Pb-210 values can not be ascribed to changes in sediment type. Examples of the sediment sorting and reworking environment can be seen in cores E4C1 (and E4C2) and F1C5 (and F1C4). Both cores from station E4 have about 80% sand with some fine sediment and water content values of about 32% at the top that decrease to about 22% at the core bottom. The effects of biological mixing as well as physical mixing can be seen in the E4C1 x-radiograph where several burrows are clearly visible. Cores F1C5 (and F1C4) may provide a snapshot of sediment sorting and reworking in progress. Located at the edge of the sediment sorting and reworking environment, the F1C5 texture down core with the gravel fraction increasing from 0% at the surface slightly to about 40% at the bottom and the sand coarsening from about 80% very fine and fine sand at the surface to about 50% very fine and fine sand at the bottom. Core F3C1, from an area of the seafloor characterized by coarse-grained bed load transport, contains greater than 98% sand from top to bottom in the core and ranges from 7% water content at the top to about 20% at the bottom. The trend in water content values suggests that this core most likely drained during storage and core cutting. At least two different layers of denser sand can be seen in the x-radiograph and the bedding at 20 cm appears to be cross-bedded. The homogeneity of the texture within the core indicates that the sedimentation regime in this area has not changed in the recent past. Though the sedimentation regime generally moves from erosion or non-deposition in eastern LIS to fine-grained deposition in the western part of LIS, different sedimentary environments can exist in close proximity throughout the Sound. This patchiness of different sedimentary environments is particularly evident south and west of the Housatonic River (see sedimentary environments map in Knebel and others, 2000) (see map). Three stations from the southern part of transect B serve as an example of the patchiness. All the cores from station 5 (B5C3, B5C4, B5C5) have a fine fraction of 90% or greater and water content values for cores from fine-grained depositional environments. The x-radiograph for B5C5, the longest of the three cores, exhibits some possible interbedding of slightly coarser and finer sediments below 35 cm. By comparison, the water content at the top of B6C1 is similar to the water content at the top of the station B5 cores but the water contents at the bottom of B6C1 are about half the water content of the B5 cores. Denser, and presumably sandier, sediment appears in the B6C1 x-radiograph when compared to the B5 cores. Also the lower water content values, especially below 10 cm, give evidence for a coarser core (see previous discussions about the correlation of water content and the fine fraction). B6C1 is located in the sedimentary environment characterized by sorting and reworking so these features are not surprising. Like the B5 cores, core B7C1 is located in the fine-grained depositional environment. B7C1 has a large fraction of fine sediments (above 90% with the exception of the surface interval) and high water content values. The B5, B6, and B7 stations are about 5 km apart in total with B6C1 and B7C1 located approximately 2 kilometers from each other (see Figure 4).
X-radiographs, water content, and sediment texture can give evidence for changing sedimentation regimes with space and time. Core A1C1 has a 2 - 3 cm interval with bedding features at 50 cm depth and is typical of a core from a fine-grained depositional environment, although the station is located quite close to an erosional environment. Cores D1C3 and D1C4 show an interesting series of laminations below 30 cm. The core location is about 0.5 km off-shore and was collected in 9-10 meters of water. If a constant sedimentation rate is assumed down to 10.25 cm, then a sedimentation rate of 0.16-0.24 cm/yr can be calculated from the Cs-137 onset and peak and the heavy metals peak. A constant sedimentation rate from top to bottom in the core seems unlikely. The sand-rich layer from 12-18 cm may have been deposited during a storm even, perhaps when Hurricane Carol passed over eastern LIS in 1954. The Pb-210 data is less clear than the Cs-137 and metals data and interpretation is complicated by the presence of the sand layer. The sand layer is depleted in Pb-210, even when normalized to the fine (silt and clay) fraction, which is an indication that the sand layer was likely Pb-210 depleted (or "old") and was deposited in one event. The sedimentation rate calculated from Pb-210 using the slope of the Pb-210 concentrations down to 12.75 cm depth was 0.44 cm/yr though it is likely that this sedimentation rate is too high because the Pb-210 concentrations have not reached background levels. The sedimentation rate calculated from Pb-210 by fitting a slope to the concentrations down to 22.75 cm depth (excluding 12.75, 15.25, and 17.75, which are in the sand-rich layer) was 0.46 cm/yr. The Pb-210 sedimentation rates probably differ than the rates calculated from Cs-137 and the metals because the sedimentation history is more complicated below 12.75 cm as seen in features such the burrow extending from 20-35 cm and the interbedded sands and muds. These interbedded sands and muds may be due to shifting of the sedimentation environment because patches of environments dominated by erosion or non-deposition and by sediment sorting and reworking are located nearby the core location. Sedimentation seems to have been nearly constant at the D1C3 core location over the 45-50 years previous to the core collection, comprising the top 10-12 centimeters of the core. The more complicated depositional features below 12 centimeters may be due to changes in the dominant sedimentary processes at this location. An alternative explanation may be that the dominant sedimentary processes have changed in the area where the core was collected.
Core x-radiographs show sedimentary structures that give evidence to shifting
local sedimentation regimes or episodic events. Core B1C2
contains coarsely interbedded sands and muds. Radionuclide and chemistry results indicate a high sedimentation rate at this location. A sedimentation rate calculated from the Cs-137 onset gives a rate of 0.78 cm/yr. This sedimentation rate compares well with a rate of 0.82 cm/yr calculated from the Hg concentration peak at 35 cm (Varekamp and others, 2003). The Hg concentration peak (with a value
more than twice any other Hg value in LIS) is most likely the result of the
1955 Housatonic River flood. Sedimentation may slow further up in the core since the sedimentation rate calculated from the well-defined Cs-137 peak is 0.61 cm/yr. The sedimentation rate calculated from the Pb-210 profile is higher than the other calculated rates at 1.10 cm/yr, but this higher rate is not surprising given that background levels of Pb-210 had not been reached at the bottom of the core G1C1
is located off the Connecticut coast west of the Connecticut River in a
small area characterized by fine-grained deposition that is surrounded by areas characterized by coarse-grained
bedload transport. The core contains interbedded sands and fines with
a ~12-cm thick sand-rich layer between 20 and 35 cm; the sand-rich layer can
also be seen in a second core collected at this station, G1C2.
The layer may be terrestrial in origin as polysterene balls, which are clearly from an anthropogenic source, were found
in the sand layer when the core was sampled for its foraminifera fauna
(E. Thomas, Wesleyan University, oral communication, Nov. 4-6, 2004). Though the G1C1 sediments above about 30 cm depth appear to be well-mixed because neither a distinct Cs-137 nor a clear metals peak can be seen, the presence of Cs-137, above-background metals values, and above-background Pb-210 values in the upper 30 cm indicate that the sediments were deposited after the 1940s and that the sand layer is relatively recent in origin." This sand-rich
layer may have been deposited either by a storm event such as a hurricane
or by a flood event from the Connecticut River. One possibility is Hurricane
Carol, which passed directly over eastern LIS in 1954. The hurricane was
a category 2 storm at land fall and struck at an astronomical high tide
resulting in a storm surge of more than 3 m above mean sea level (Donnelly
and others, 2001). |
|||||||
| Accessibility | FOIA | Privacy | Policies and Notices | |
 |
|