|
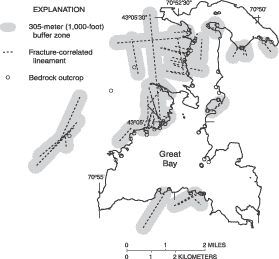
| Figure 6. Location of fracture-correlated lineaments with a 305-meter (1,000-foot) buffer zone determined by buffer analysis in relation to the shoreline of Great Bay, N.H. |
Fracture data were collected at stations along the shoreline of Great Bay where wave-eroded horizontal and vertical exposures of bedrock provided a three-dimensional view of the bedrock. A total of 287 fracture-orientation measurements from 49 outcrop stations were analyzed and compared with the 927 lineaments. Locations of observed outcrops of bedrock are shown on plate 1(1.6 MB, pdf) and on figures 2 and 6. Seventy-one percent of open fractures were mapped in the Kittery Formation on the west side of the bay. The highest density of lineaments and fracture-correlated lineaments was identified on the west side of the bay in the Exeter Diorite and Kittery Formation, where the till overburden generally is thin. Lithologic contact, and bedding and foliation trends were observed parallel to fracture-correlated lineaments.
Thirty-seven percent of the lineaments (53 of 143 lineaments) within 305 m of an outcrop with fractures were identified as fracture correlated by use of the buffer analysis (fig. 6). This value is the largest percentage of lineaments correlated by any of the fracture-correlation techniques used in this study. The density and location of fractured-bedrock outcrops will affect strongly the results of fracture correlation by the buffer analysis. This analysis is not applied to lineaments that fall beyond 305 m of any outcrop. Results from domain analysis identify fracture-correlated lineaments in areas far from fractured outcrops, although in this study the technique selected fewer fracture-correlated lineaments than the buffer analysis.
In the domain cells, 30 percent of the lineaments (120 of 399 lineaments) were identified as fracture correlated by the domain discrete-measurement analysis. The domain cells each had 3 to 6 different fracture family principal-peak trends with normalized heights above 50 percent (fig. 7).
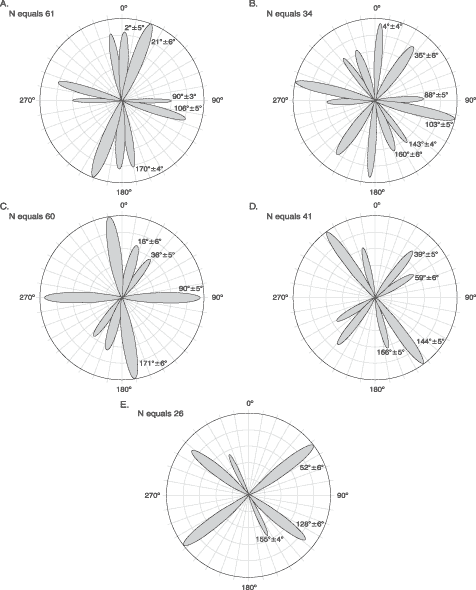 |
| Figure 7. Azimuth-frequency plots of discrete-measurement analysis of fracture data from domain cells, Great Bay, N.H. The length of the family peaks on the plots indicates the normalized height. Circle interval equals 20 percent, increasing outward. The width of the peak represents the standard deviation, or range, of orientation for each family. Principle peaks with normalized concentrations greater than 50 percent are plotted. Letters (A-E) correspond to letters in domain cell locations in figure 2. |
Nineteen percent of the lineaments (77 of 399 lineaments) in domain cells were identified as fracture correlated by the domain-spacing-normalized analysis. The domain cells each had 2 to 4 different fracture-family trends with normalized heights above 50 percent (fig. 8). The relation between principal peaks for discrete-measurement and spacing-normalized domain analysis is shown in table 1. Domain-spacing-normalized analysis identified the least number of fracture-correlated lineaments in this study. This analysis also yielded a smaller number of principal peaks with the fracture data than the domain-discrete-measurement analysis. Normalizing for fracture spacing can mask the trends of sets that have large fracture spacings. Domain-discrete-measurement analysis identified peaks that correlate with peaks from open and vug-filled fractures that domain-spacing-normalized analysis did not identify.
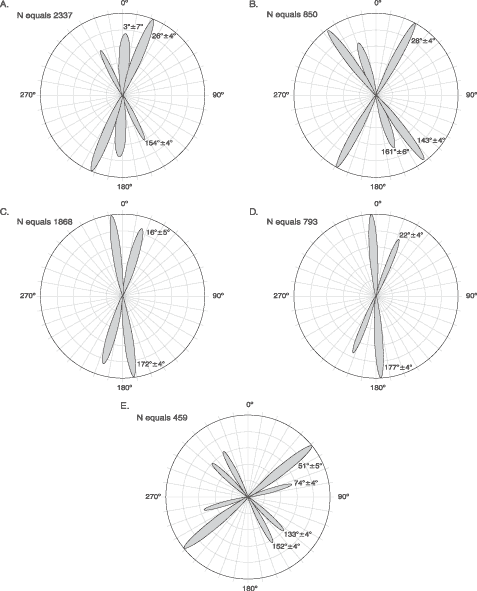 |
| Figure 8. Azimuth-frequency plots of spacing-normalized analysis of fracture data from domain cells, Great Bay, N.H. The length of the family peaks on the plots indicates the normalized height. The width of the peak represents the standard deviation, or range, of orientation for each family. Principle peaks with normalized concentrations greater than 50 percent are plotted. Circle interval equals 20 percent, increasing outward. Letters (A-E) correspond to letters in domain locations in figure 2. |
High concentrations of fracture-correlated lineaments were identified in areas with many outcrops. Seventy-one percent of fracture-correlated lineaments and 66 percent of all lineaments are found on the west side of the bay, where overburden is thin. The highest density of lineaments and fracture-correlated lineaments (10 and 3 per km 2 , respectively) were on the west side of the bay in the Exeter Diorite and Kittery Formation, where the till overburden generally is thin. Sand-and-gravel settings had lineament and fracture correlated-lineament densities of 5 and 1 per km 2 , respectively. All of the lineaments mapped with color infrared air photography beneath the surface of the bay water were fracture correlated. Bedrock type and contacts also appear to affect fracture-correlated lineament density and trends.
Approximately east-west trending fracture-correlated lineaments near the shore of Great Bay are dominant in the northwestern part of the study area, between Durham Point and just south of Adams Point. The geology of this area is mapped as the Kittery Formation, and the trends of the lineaments roughly are parallel to the trend of the bedding and of open and vug-filled fractures. Just inland and westward from this area and to the south along the western shore, fracture-correlated lineaments trend roughly north, from north-northwest to north-northeast. These lineaments are identified in the Exeter Diorite, and strike roughly parallel to its contact with the Kittery Formation. To the southwest in Newmarket, fracture-correlated lineaments switch direction from north-northeast to northeast, parallel to the shift at the Exeter Diortite and Kittery Formation contact.
The Kittery Formation on the northwestern side of the bay may represent an area of increased hydraulic connection to Great Bay for the following reasons: (1) there is a high density of relatively open fracture-correlated lineaments oriented perpendicular to the bay, and (2) the Kittery Formation has been identified by Moore and others (in press) as having an increased probability for high-yielding [greater than or equal to 151 L/min (40 gal/min)] bedrock. However, the upland (recharge) area immediately west of this zone has no stratified drift and is Exeter Diorite, which has a much lower probability for high-yielding bedrock (Moore and others, in press) than the Kittery Formation. Additionally, the fracture-correlated
|
|
||||
|---|---|---|---|---|
| Domain cell (fig. 2) |
Domain | |||
|
|
||||
| Discrete-measurement analysis | Spacing-normalized analysis | |||
|
|
||||
| A | 2 | 3 | ||
| 21 | 22 | |||
| 270 | -- | |||
| 286 | -- | |||
| 350 | 334 | |||
| B | 4 | -- | ||
| 35 | 28 | |||
| 88 | -- | |||
| 283 | -- | |||
| 323 | 323 | |||
| 340 | 341 | |||
| C | 16 | 16 | ||
|
36 |
-- | |||
| 90 | -- | |||
| 351 | 352 | |||
| D | 39 | 22 | ||
| 59 | -- | |||
| 324 | -- | |||
| 346 | 357 | |||
| E | 52 | 51 | ||
| -- | 74 | |||
| 308 | 313 | |||
| 335 | 332 | |||
|
|
||||
lineaments in the Exeter Diorite west of the bay, although fairly dense, are oriented parallel to the bay (north-south) and not directly towards it. Therefore, although bedrock on the western shore of the bay may have an increased hydraulic connection to the bay, this particular area may discharge relatively little ground water considering a lack of inland storage and hydraulic connection.
North-northeast trending fracture-correlated lineaments are identified east of the bay, which parallel the trends of the foliation and bedding in the Eliot Formation and are parallel to the contact between the Kittery and Eliot Formations on the east side of Little Bay. On the south shore of Great Bay, most of the fracture-correlated lineaments identified in the Eliot Formation roughly parallel the contact with the Kittery Formation, mapped at the bay.
Although there are fewer lineaments on the east side of the bay, and they pass through rock with a lower probability of high yield than the west side of the bay (Moore and others, in press), some of the fracture-correlated lineaments on the east side are oriented towards, and may represent fracture zones connected to, large upland stratified-drift deposits. Hydraulic connection to upland stratified-drift deposits may provide a source of recharge, with a large head gradient forming localized springs or appreciable sources of ground-water discharge on the east side. A few fracture-correlated lineaments on the south side of the bay may be fracture zones that could serve as hydraulic conduits to upland stratified-drift-recharge sources, and result in points of concentrated fresh ground-water discharge to the bay.
Of the 927 lineaments in the study area (plate 1(1.6 MB, pdf)), 406 lineaments are within 305 m of an outcrop or intersect a domain cell. Of the 406 lineaments, 190 (or 47 percent) of the lineaments were classified as fracture correlated by at least one of the three analysis techniques described in the section "Fracture-correlation techniques." Only 15 percent of lineaments (60 of 399 lineaments) were identified as fracture correlated by more than one technique. Fracture-correlated lineaments sometimes are parallel to other geologic features such as lithologic contacts, and bedding and foliation trends.
Next: Summary and Conclusions
Previous: Bedrock and Factures
Table of Contents
| AccessibilityFOIAPrivacyPolicies and Notices | |
 |
|