
Results
of Streamflow Gain-Loss Studies in Texas, With Emphasis on Gains From and Losses
to Major and Minor Aquifers
U.S. Geological Survey - Open-File Report 02-068
By Raymond M. Slade, Jr., J. Taylor Bentley,
and Dana Michaud
You will need Acrobat Reader to read the PDF version of
this report. If you do not have Acrobat Reader, you may download it here: http://www.adobe.com/products/acrobat/alternate.html
Download Report:
Results of Streamflow Gain-Loss
Studies in Texas, With Emphasis on Gains From and Losses to Major and Minor
Aquifers, Texas, 2000 (.pdf) 3.58MB
Contents:
Abstract
Introduction
Purpose and Scope
Ancillary Benefits
Method of Gain-Loss Studies
Results
Studies in All Reaches
Studies in Reaches Intersecting
Aquifer Outcrops
Additional Information and
Qualifications
Selected References
Plates:
Plate 1.
Map Showing Locations of StreamflowGain-loss Sites of Major
Aquifers in Texas
Download Plate 1: PDF format (8.73MB)
Plate 1 (.pdf) or zipped
format Plate 1 (.zip)
Plate 2.
Map Showing Locations of StreamflowGain-loss Sites and Outcrops
of Minor Aquifers in Texas
Download Plate
2: PDF format (6.33MB) Plate 2
(.pdf) or zipped format
Plate 2 (.zip)
Tables:
Table 1. Characteristics
of flow gain-loss studies in Texas(.xls) or
as a text file Table 1 (.txt)
Table 2.
Inventory of daily mean streamflows for active and discontinued
streamflow-gaging stations in Texas (.xls) or as
a text file Table 2 (.txt)
Table 3.
Median streamflow and associated hydraulic characteristics
for streamflow-gaging stations in Texas (.xls) or
as a text file Table 3 (.txt)
Table 4.
Gains and losses from gain-loss studies in Texas (.xls)
or as a text file Table 4 (.txt)
Abstract
Data for all 366 known streamflow gain-loss studies conducted
by the U.S. Geological Survey in Texas were aggregated. A water-budget equation
that includes discharges for main channels, tributaries, return flows, and withdrawals
was used to document the channel gain or loss for each of 2,872 subreaches for
the studies. The channel gain or loss represents discharge from or recharge to
aquifers crossed by the streams. Where applicable, the major or minor aquifer
outcrop traversed by each subreach was identified, as was the length and location
for each subreach. These data will be used to estimate recharge or discharge for
major and minor aquifers in Texas, as needed by the Ground-Water Availability
Modeling Program being conducted by the Texas Water Development Board. The data
also can be used, along with current flow rates for streamflow-gaging stations,
to estimate streamflow at sites remote from gaging stations, including sites where
streamflow availability is needed for permitted withdrawals.
Introduction
As part of the Ground-Water Availability Modeling (GAM) Program currently (2001)
being conducted by the Texas Water Development Board (TWDB), data are needed to
quantify the interaction of surface water and ground water for the nine major
aquifers (Ashworth and Hopkins, 1995) and most of the 20 minor aquifers in Texas.
Where streams flow across aquifer outcrops, channel gains and losses constitute
aquifer discharge and recharge, respectively. To make this aquifer discharge and
recharge information available for the GAM Program, the U.S. Geological Survey
(USGS), in cooperation with the TWDB, compiled data and computed streamflow gains
and losses from all available records of gain-loss studies done by the USGS in
Texas.
Since 1918, the USGS has conducted streamflow gain-loss studies on streams throughout
much of Texas. The usual objective of the gain-loss studies was to obtain data
that could be used to estimate discharge from or recharge to shallow aquifers.
Most gain-loss studies were done during low-flow conditions because low flows
are more likely to be steady (not changing with time) than other flows (except
in reaches downstream from major springs or reaches downstream from reservoirs
where sustained releases account for most of the flow).
In 1958, the data for all known streamflow gain-loss studies were compiled and
published in a report by the Texas Board of Water Engineers (currently the TWDB)
and the USGS (Texas Board of Water Engineers, 1960). The data for most of the
studies done since 1958 have been published in annual data reports and other reports
by the USGS. This study carries the documentation of gain-loss studies a step
farther: The gains and losses in stream subreaches (channel segments between flow-measuring
sites in a reach) were related to major and minor aquifer outcrops in digital
and geographic information system (GIS) databases.
Purpose and Scope
The purpose of this report is to summarize the results of 366 gain-loss studies
involving 249 unique reaches of streams throughout Texas since 1918. The locations
of subreaches for which gains and losses were computed are indicated by streamflow-measurement
sites on maps of major and minor aquifer outcrops. The gain-loss studies are tabulated
by sequential number, major river basin, stream name, and reach identification,
and the total gain or loss for each reach is given. The gains and losses for each
subreach are tabulated by sequential number for the gain-loss study and located
by latitude and longitude of the upstream end of the subreach. Where applicable,
the major or minor aquifer outcrop traversed by a subreach is identified.
Ancillary Benefits
The compilation of streamflow gain-loss data could be beneficial to the Water
Uses and Availability Section of the Water Resources Management Division of the
Texas Natural Resource Conservation Commission (TNRCC). That section is responsible
for permitting surface-water withdrawals in Texas. Most of the recently issued
permits represent contingency permits, which authorize surface-water withdrawals
only when the streamflow exceeds a threshold rate. The threshold streamflow rate
for each contingency permit generally represents the total discharge needed to
sustain permitted withdrawals downstream from the withdrawal point for the contingency
permit plus any streamflow required as inflow to receiving bays or estuaries.
Contingency permits are used to protect the existing water rights of users downstream
from newer users.
The TNRCC and others associated with surface-water usage often use USGS current
streamflow data available on the World Wide Web to verify existing streamflow
conditions pertinent to contingency permits. However, there are only about 350
existing streamflow-gaging stations, and the location of withdrawal points for
contingency permits often are many miles from the nearest streamflow-gaging station.
Stream-channel gain and loss data can be used, along with the current streamflow
rates for gaging stations, to estimate the current streamflow for sites remote
from the gaging stations, including sites that represent surface-water withdrawals
for contingency permits.
Reservoir owners also could benefit from the compilation of streamflow gain-loss
data. Many reservoir owners are required to release sufficient water to sustain
the permitted withdrawal rate for downstream water rights. The permitted users
are guaranteed a specific withdrawal rate. The gains and losses of channel flow
can be used by reservoir owners to help determine reservoir release rates needed
to sustain permitted downstream withdrawal rates.
Method of Gain-Loss Studies
The usual method of gain-loss studies is to identify a stream reach and obtain
streamflow measurements along the main channel of the reach. The location of each
main-channel measurement site is referenced and documented as a distance on the
stream channel, usually upstream from its mouth. The channel gain or channel loss
can be computed for the subreach between each main-channel measurement site by
equating inflows to outflows plus flow gain or loss in the subreach:
| |
|
Qu
+ Qt + Qr = Qd + Qw + Qe + Qg, (1) |
|
| where |
| |
|
Qu = streamflow
in at upstream end of subreach; |
|
| |
|
Qt = streamflow
from tributaries into subreach; |
|
| |
|
Qr = return flows
to subreach; |
|
| |
|
Qd = streamflow
out at downstream end of subreach; |
|
| |
|
Qw = withdrawals
from subreach; |
|
| |
|
Qe = evapotranspiration
from subreach; and |
|
| |
|
Qg = gain (positive)
or loss (negative) in subreach. |
|
| |
Thus, |
|
| |
|
Qg
= Qu + Qt + Qr – Qd – Qw – Qe. (2) |
|
For most streams, underflow (flow parallel to stream through shallow channel-bed
deposits) and bank storage are considered negligible or minimal.
Many of the studies were done during winter to minimize evapotranspiration. Also,
the short length of most subreaches and minimal width of the streams during low-flow
conditions would allow only minimal evapotranspiration losses. Therefore, Qe is
assumed to be zero in the computations for this report. In each gain-loss study,
attempts were made to identify and measure the discharge for all flowing tributaries,
return flows, and withdrawals. If these discharges could not be measured, attempts
were made to obtain the discharges from other sources such as the TNRCC. However,
the USGS cannot verify that all inflow or outflow sources for the reaches were
accounted for.
Results
Studies in All Reaches
Three-hundred sixty-six streamflow gain-loss studies in 249 unique reaches were
identified and included in this investigation. More than one study has been done
at many of the reaches. The locations of streamflow-measurement sites for the
studies are shown on plate 1. The studies included about 4,941 measurements of
which 3,238 were made at sites on the main channels of the study reaches; the
remaining measurements were made on tributaries to the main channels or represent
withdrawals. A tabular summary of the flow-loss studies (table 1) includes for
each study the major river basin, stream name, study reach identification, date
of study, reach length (in river miles), total number of measurement sites, number
of sites on the main channel, major aquifer outcrop(s) intersected by the reach,
total streamflow gain or loss in the reach, streamflow gain or loss per mile of
reach length, and reference for the data. The reaches for many studies are identified
in table 1 by eight-digit numbers for streamflow-gaging stations. Station numbers
and associated station names for Texas streamflow-gaging stations with daily streamflow
data are listed in table 2.
Table 3 presents selected streamflow characteristics for all streamflow-gaging
stations with computer-stored discharge measurements and daily mean streamflows
in Texas (346 sites). These data include the station number and name, latitude
and longitude, contributing drainage area, and the following data pertinent to
median flow conditions: the streamflow, gage height, stream width, stream cross-sectional
area, mean velocity, and mean stream depth. Also presented is the elevation of
the datum of the gage, which can be added to the gage height to obtain the water-surface
elevation above sea level for the median streamflow. The streamflow at the gaging
station during a gain-loss study can be compared to the median streamflow to assess
the flow conditions during the study.
Equation 2 was used to compute the streamflow gain or loss for each subreach.
The data and information for the gains or losses in each of 2,872 subreaches (table
4) include the latitude and longitude at the upstream end of the subreach, the
underlying major or minor aquifer outcrop, the streamflow gain or loss, the stream
subreach length, the location (river mile) of the upstream end of the subreach,
and a descriptive location for selected upstream ends.
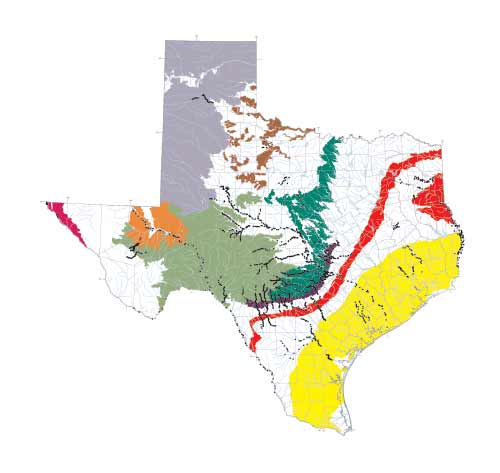
Plate
1. Locations of StreamflowGain-loss Sites and Outcrops of Major Aquifers in Texas
The data for most of the studies have been published. The references (table 1)
can be consulted for additional information about a study. Detailed descriptions
for most of the measuring-site locations are in the referenced reports.
Studies in Reaches Intersecting Aquifer Outcrops
Most of the gain-loss studies involved reaches that intersect at least one major
aquifer outcrop, and many intersect more than one major aquifer outcrop (pl. 1).
Relatively few studies have been done involving reaches that intersect the outcrops
of the Hueco-Mesilla Bolson and Ogallala aquifers and none involving the Seymour
aquifer; however, gain-loss studies have been done for many of the major streams
that intersect the other six major aquifer outcrops.
Numbers of gain-loss studies associated with the nine major aquifer outcrops in
Texas:
| Major
aquifer outcrop |
Number
of
gain-loss
studies |
| Carrizo-Wilcox |
47 |
| Cenozoic
Pecos Alluvium |
53 |
| Edwards
(Balcones fault zone) |
126 |
| Edwards-Trinity
(Plateau) |
82 |
| Gulf Coast |
28 |
| Hueco-Mesilla
Bolson |
6 |
| Ogallala |
5 |
| Seymour |
0 |
| Trinity |
92 |
Plate 2. Locations of StreamflowGain-loss Sites and Outcrops of Minor Aquifers
in Texas
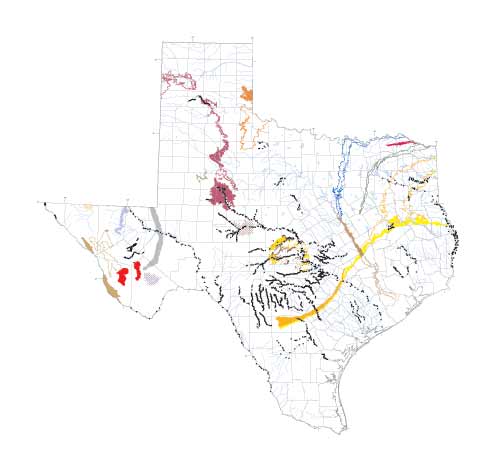 Plate
2 shows the locations of gain-loss studies in reaches that intersect outcrops
of minor aquifers in Texas. Not surprisingly, fewer studies involved reaches
intersecting minor aquifer outcrops because the areal extent of minor aquifer
outcrops is appreciably less than that of major aquifers.
Plate
2 shows the locations of gain-loss studies in reaches that intersect outcrops
of minor aquifers in Texas. Not surprisingly, fewer studies involved reaches
intersecting minor aquifer outcrops because the areal extent of minor aquifer
outcrops is appreciably less than that of major aquifers.
Additional Information and Qualifications
Streamflow studies were conducted more than once for many of the reaches. For
most reaches with multiple studies, the gains or losses differ between the studies.
Much of the difference in gains or losses probably is caused by varying water
levels in aquifers adjacent to the reaches. For example, periods of high recharge
preceding a study could result in large flow gains, and "dry" conditions
preceding a study could result in smaller gains or result in losses. Also, varying
bank storage could cause differences in gains or losses. As previously stated,
the studies summarized in this report considered bank storage to be minimal
or negligible. However, bank storage could represent a substantial source of
inflow to main channels of some streams, particularly streams in alluvial outcrops.
Streamflow data from nearby gaging stations, if available, can indicate whether
bank flow is more than a minimal source of water. Large daily streamflows for
dates preceding a gain-loss study could imply high recharge conditions and substantial
bank flow.
Streamflow data from gaging stations can be used to supplement or augment data
from channel gain-loss studies. For example, many streams have more than one
gaging station. Daily flow data at proximate gaging sites on the same stream
can be used to estimate gains or losses in channel flow for the reach between
the stations. Current and historic streamflow data for Texas streamflow-gaging
stations are available on the World Wide Web at http://tx.usgs.gov
Streamflow gains and losses are subject to error because of potential error
in the streamflow measurements. The potential error in each streamflow measurement
typically is about 5 to 8 percent; however, the potential error for most streamflow
gains or losses is larger than that, and the potential error increases as the
ratio of the gain (or loss) to the measured flow increases. For example, the
potential error in a measured flow of 10 cubic feet per second (ft3/s) for a
main-channel site would be about 0.5 ft3/s, and the potential error for 11 ft3/s
measured at a downstream main channel site would be about 0.5 ft3/s. The total
potential error therefore would be about 1.0 ft3/s for the two measured flows,
which is comparable to the computed gain of 1.0 ft3/s for the reach between
the sites; thus the actual gain could range from 0 to 2.0 ft3/s.
SELECTED REFERENCES
Ashworth, J.B., and Hopkins, Janie, 1995, Major and minor aquifers of Texas:
Texas Water Development Board Report 345, 69 p.
Baker, E.T., Jr., Slade, R.M., Jr., Dorsey, M.E., and Ruiz, L.M., 1986, Geohydrology
of the Edwards aquifer in the Austin area, Texas: Texas Water Development Board
Report 293, 216 p.
Land, L.F., Boning, C.W., Harmsen, Lynn, and Reeves, R.D., 1983, Streamflow
losses along the Balcones fault zone, Nueces River Basin, Texas: U.S. Geological
Survey Water-Resources Investigations Report 83–4168, 72 p.
Slade, R.M., Jr., Gaylord, J.L., Dorsey, M.E., Mitchell, R.N., and Gordon, J.D.,
1982, Hydrologic data for urban studies in the Austin, Texas, metropolitan area,
1980: U.S. Geological Survey Open-File Report 82–506, 264 p.
Texas Board of Water Engineers, 1960, Channel gain and loss investigations,
Texas streams, 1918–1958: Texas Board of Water Engineers Bulletin 5807–D, 270
p.
U.S. Geological Survey, 1963–65, Surface water records of Texas 1962–64: U.S.
Geological Survey [variously paged].
______1966–70, 1972, 1975, Water resources data for Texas, water years 1965–69,
1971, 1974—Part 1. Surface water records: U.S. Geological Survey [variously
paged].
______1976–77, 1981–82a, 1986, Water resources data for Texas, water years 1975–76,
1980–81, 1985–Volume 3. Colorado River Basin, Lavaca River Basin, Guadalupe
River Basin, Nueces River Basin, Rio Grande Basin, and intervening coastal basins:
U.S.Geological Survey Water-Data Reports TX–75–3, 510 p.; TX–76–3, 557 p.; TX–80–3,
583 p.; TX–81–3, 599 p.; TX–85–3, 447 p.
______1980, Water resources data for Texas, water year 1979—Volume 2. San Jacinto
River Basin, Brazos River Basin, San Bernard River Basin, and intervening coastal
basins: U.S. Geological Survey Water-Data Report TX–79–2, 511 p.
______1982b, Water resources data for Texas, water year 1981—Volume 1. Arkansas
River Basin, Red River Basin, Sabine River Basin, Neches River Basin, Trinity
River Basin, and intervening coastal basins: U.S. Geological Survey Water-Data Report TX–81–1, 597 p.
For additional information write to:
District Chief
U.S. Geological Survey
8027 Exchange Dr.
Austin, TX 78754–4733
E-mail: dc_tx@usgs.gov
Copies of this report can be purchased from:
U.S. Geological Survey
Branch of Information Services
Box 25286
Denver, CO 80225–0286
E-mail: infoservices@usgs.gov
