Open-File Report 03-111
|
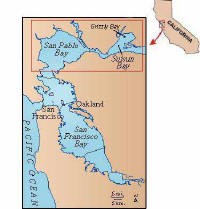
Figure 1: Study area (red box in large figure) and location map. During the mid-to late-1800's, large quantities of tailings from hydraulic gold mining in the Sierra Nevada were deposited in San Francisco Bay (Gilbert, 1917; Jaffe et al., 1998; Capiella et al., 1999). This rapid deposition also choked river systems and deposited mercury-contaminated sediments in the rivers and Bay. Hydraulic mining was stopped in 1884 by a California Supreme Court decision. Deposition in the Bay slowed in the late 1800's and early 1900's as a result of this decrease in sediment supply (Jaffe et al., 1998; Capiella et al., 1999). During the mid-1900's, sediment supply was further reduced by water works projects (dams, diversions, etc.), creating an erosional system in the study area by the late 1900's. The re-working of these sediments poses environmental and biological concerns regarding mercury in the bay. The location of these deposits is important for understanding the health of the bay waters. In March 2000, the U.S. Geological Survey collected sediment cores in the study area to determine the location of mercury-contaminated hydraulic mining debris. The study area (Figure 1) comprises 400 km2 and consists of San Pablo Bay and Suisun Bay, both of which are part of the San Francisco Bay estuary. Grizzly Bay (Figure 1), a subembayment of Suisun Bay, is also part of the study area. For the purpose of this report the term Suisun Bay will be used collectively for both areas. The present channel system in Suisun Bay (Figure 2 179 kb JPEG) is composed of three channels that flow through the bay. The primary channel runs in the southern section of Suisun Bay. A smaller channel flows between Roe Island and Ryer Island. The deepest channel flows through Suisun Cutoff, north of Ryer Island, and past Grizzly Bay. All three channels join at Carquinez Strait where they continue through the southern section of San Pablo Bay, and into San Francisco Bay. The average depths in San Pablo and Suisun Bays at mean sea level are 3.7 m and 5.8 m, respectively (Smith et al., 2002). This report documents preliminary analyses conducted on a subset of the cores collected on the March 2000 cruise. Field and laboratory methods used to analyze the cores are described. Field core descriptions, core X-radiographs, classification of stratigraphy from X- radiographs, and magnetic susceptibility are presented in the data section. This research was supported by USGS San Francisco Bay Place Based Studies and the USGS Toxics Program. Many people helped collect the cores presented in this report. Gordon Smith, Institute for Marine Science at UC Santa Cruz and Captain of the RV David Johnson, operated the boat and winches with great skill to make core collection as easy as possible. Walt Olsen, USGS, was the Marine Technician for the cruise. Roberto Anima, USGS, has collected many cores from SF Bay and taught us the fine points of and assisted in core collection. Ryan Leech, USGS, helped prepare a sample strategy, organize volunteers, and collected cores. Kathy Presto, USGS, was navigator and assisted in collecting cores. Richard Smith and Jim Lugosi, USGS, also assisted in core collection. Mark Marvin DiPasquale and Jennifer Agee, USGS, helped with collection and sampling of box cores. Anja Boelm, a UC Santa Cruz graduate student, logged cores aboard the RV David Johnson. Heather Little and Alexa La Plante, UC Santa Cruz students, assisted in core collection. The coring locations were chosen in both erosional areas where mining deposits are either absent or suspected to be at the surface, and in regions where the debris is suspected to be buried (Jaffe et al., 1999). Field (core collection, handling, and describing) and laboratory (X- radiographs, description of X- radiographs, and magnetic susceptibility) methods are described below. Core Collection and Handling
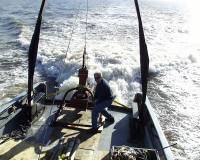
Figure 3: Rich Smith aboard the RV David Johnston, March 2000. More photos of the coring operation are available. Sediment cores were collected from the RV David Johnston (Figure 3) in March 2000, during field activity J-2-00-SF. Two types of cores were collected, box cores and gravity cores. Both types were collected using USGS coring equipment. The dimensions of the box corer is 30 cm wide, 20 cm deep, and 45 cm high. The 9-cm in diameter gravity cores were collected using an 800 lb weight and 3 m long barrel. After collection, gravity cores were cut in 1.5 m sections to facilitate transport and storage. Each section was capped. Initially, cores were stored upright onboard the Johnston to allow sediments to solidify in an attempt to minimize disruption of stratigraphy during transport. Later, gravity cores were transported horizontally and stored horizontally in a large refrigerator at 3.8° C. Box cores were sub-sampled immediately after coming onboard. Sub-sampling included taking sediment cores with gravity core liners and slabs. Slabs (20 cm wide, 22-44 cm long, and 3 cm thick) were taken by pressing a plexiglass form into the side of the box core after careful removal of one of the box core walls. Sub-samples were also stored in a refrigerator at 3.8° C. Field Descriptions of Cores Gravity cores were described onboard immediately after cutting the core. These descriptions are based on observations through core liners, augmented by observations of sediment at section ends and in the core catcher. The field descriptions were compiled in a table and include the setting, geographic coordinates, notes on the coring process, and description of material in both the core catcher and the cores. X-Radiographs Each gravity core was X-rayed as a whole core, using X-ray equipment on the USGS Menlo Park campus. The 1.5-m long core sections were typically X-rayed in 30-40 cm increments with 5-20 cm of overlap between X-rays. We used 60kV/20mA of radiation per scan. The box cores were X-rayed using the Faxitron X-ray system designed for slabs and short cores also located on the Menlo Park campus. The X-rays were then developed using on-site developing equipment. X-radiographs were then scanned and edited to enhance contrast. Descriptions of X-Radiographs The X-radiographs were described using a light table, and by creating categories for stratification and shell appearance. The stratification categories separate massive, distinctly laminated, moderately laminated, and faintly laminated regions in the core. The different shell categories distinguish disarticulated shell fragments and articulated shells. A color code (Figure 4 28 kb JPEG) was then applied to each category for graphing and comparing with the magnetic susceptibility data. Magnetic Susceptibility Magnetic susceptibility testing was performed on the gravity cores using a GEOTEK® multi-sensor core logger on the Menlo Park campus. Measurements were taken every 1 cm of core using the small magnetic coil (133 mm in diameter). In preparation for the analysis, the core liner was thoroughly cleaned, all tape was removed from the end caps, and the cores were allowed to come to room temperature. The logger data is output in real-time to a software program where the data is displayed graphically and saved in a spreadsheet. The data was then graphed, and combined with the X-ray description color codes described above. The data for each core consists of a table of field descriptions, scanned images of the X-radiographs, and a magnetic susceptibility and X-ray description chart. An example of each analysis technique is provided below for reference. To view the complete data for each core click here or the "Data" link at the top of the page. Example of Field Descriptions
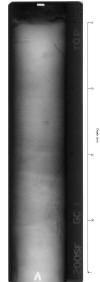
Example of X-Radiograph Figure 5 is an example of an X-radiograph from the top of GC-1. Many of our X-radiographs show burrows like this one in the upper portion (approximately 15 cm) of the core. The burrows appear as dark grey lines cross-cutting the layers in the core. Alternating mud and sand layers are also visible throughout the core. Sandier layers are more dense and appear lighter in color, while mud rich sediment appears darker in color on the X-ray. The arrows on the depth scale indicate the overlapping point between the x-rays.
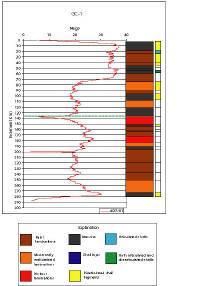
Figure 5: Example of an X-radiograph from the top section of GC-1. Example of Magnetic Susceptibility "Combined Graph" Below is an example of a magnetic susceptibility and X-ray descriptions combined graph for GC-1 (Figure 6). An explanation of the color codes is included with each graph. The wider color bar refers to the stratification categories, while the narrower bar represents the different shell categories. A white color in the narrow bar indicates no shells are present. The individual core segments are separated by the dashed green line in the center of the graph.
Figure 6: Example of a magnetic susceptibility graph for GC-1. Figure 6 shows higher magnetic susceptibilities in the upper 70 cm than in the lower 210 cm. A comparison with the color-coded description bars on the right suggests a fairly massive region in the upper half of the core with faint laminations throughout. Shell fragments are concentrated in the upper half of the core. The sharp changes in magnetic value that occur at the top and bottom of each core segment are due to end effects. Sudden drops in magnetic values within the core segments (above example at 200 cm) are due to cracks in the core. REFERENCES Capiella, K., Malzone, C., Smith, R., and Jaffe, B., 1999, Sedimentation and Bathymetry Changes in Suisun Bay: 1867-1990: U.S. Geological Survey Open File Report 99-563. http://geopubs.wr.usgs.gov/open-file/of99-563/ Gilbert, G.K., 1917, Hydraulic Mining Debris in the Sierra Nevada: U.S. Geological Survey Professional Paper 105, 154 p. Jaffe, B. E., Smith, R. E., Cappiella, K., Bouse, R., Luoma, S., and Hornberger, M., 1999, Mercury-Contaminated Hydraulic Mining Debris in North San Francisco Bay- A Legacy of the Gold Rush, (abs) Geological Society of America, Cordilleran Section Meeting, vol.31, no.6, pp.66. Smith, R.E., Jaffe, B., 2000,San Francisco Bay Bathymetry Web Site, Retrieved December 5, 2002, U.S. Geological Survey, Coastal and Marine Geology. http://sfbay.wr.usgs.gov/access/Bathy/objectives.html. Related Links: Coastal and Marine Geology InfoBank |

![]() U.S. Department of the Interior |
U.S. Geological Survey
U.S. Department of the Interior |
U.S. Geological Survey
URL: http://pubsdata.usgs.gov/pubs/of/2003/0111/intro.html
Page Contact Information: GS Pubs Web Contact
Page Last Modified: Wednesday, 02-Apr-2014 13:07:29 EDT