 Summary Summary
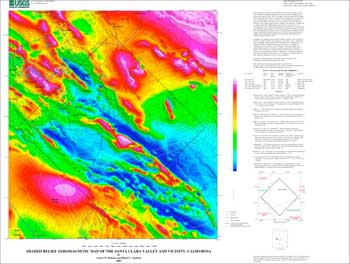
This aeromagnetic map covers the southern portion of San Francisco Bay, the Santa Clara Valley and surrounding mountains, part of which has been modelled in threedimensions (Jachens and other, 2001). The magnetic anomaly map has been compiled from existing digital data. Data was obtained from six aeromagnetic surveys that were flown at different times, spacings and elevations. The International Geomagnetic Reference Field (IGRF) for the date of each survey had been removed in the initial processing. The resulting residual magnetic anomalies were analytically continued onto a common surface 305 m (1000 ft) above terrain. Portions of each survey were substantially above the specified flight height listed in the table. The surveys were then merged together using a commercial software package called Oasis Montage. The gray lines on the map indicate the extent of each survey. The program used these regions of overlap to determine the best fit between surveys. Black dots show probable edges of magnetic bodies defined by the maximum horizontal gradient determined using a computer program by Blakely (1995).
Crystalline rocks generally contain sufficient magnetic minerals to cause variations in the Earth’s magnetic field that can be mapped by aeromagnetic surveys. Sedimentary rocks are generally weakly magnetized and consequently have a small effect on the magnetic field: thus a magnetic anomaly map can be used to “see through” the sedimentary rock cover and can convey information on lithologic contrasts and structural trends related to the underlying crystalline basement (see Nettleton,1971; Blakely, 1995). Faults often cut magnetic bodies and offset magnetic anomalies can thus be used to help determine fault motion. Serpentinite, which is highly magnetic, is often found along faults. On this map areas of low magnetic anomalies are shown in blues and green while highs are shown in reds and magentas. Faults are from Brabb and others, 1998a,1998b, Graymer and others 1996, Lienkaemper, 1992 and Wentworth and others 1998.
|
First posted September 11, 2003
The National Geologic Map Database has additional data about this publication
Part or all of this report is presented in Portable Document Format (PDF). For best results viewing and printing PDF documents, it is recommended that you download the documents to your computer and open them with Adobe Reader. PDF documents opened from your browser may not display or print as intended. Download the latest version of Adobe Reader, free of charge.
|

