
Background Data Acquired from Gamma-ray Castle
The background count rates for the gamma-ray spectrometer are measured at intervals of 15 to 30 days. Normally, the background measurements are made multiple times over a weekend using counting times of 8 hours. Figure 1 shows the count rate (counts per second) for the reference source of Cs137 that is used to stabilize the spectrum. These data indicate that the system has a slow drift over time with the count rates slowly increasing. The change that occurs in August, 2001 corresponds to an adjustment made to the energy calibration of the spectrometer.
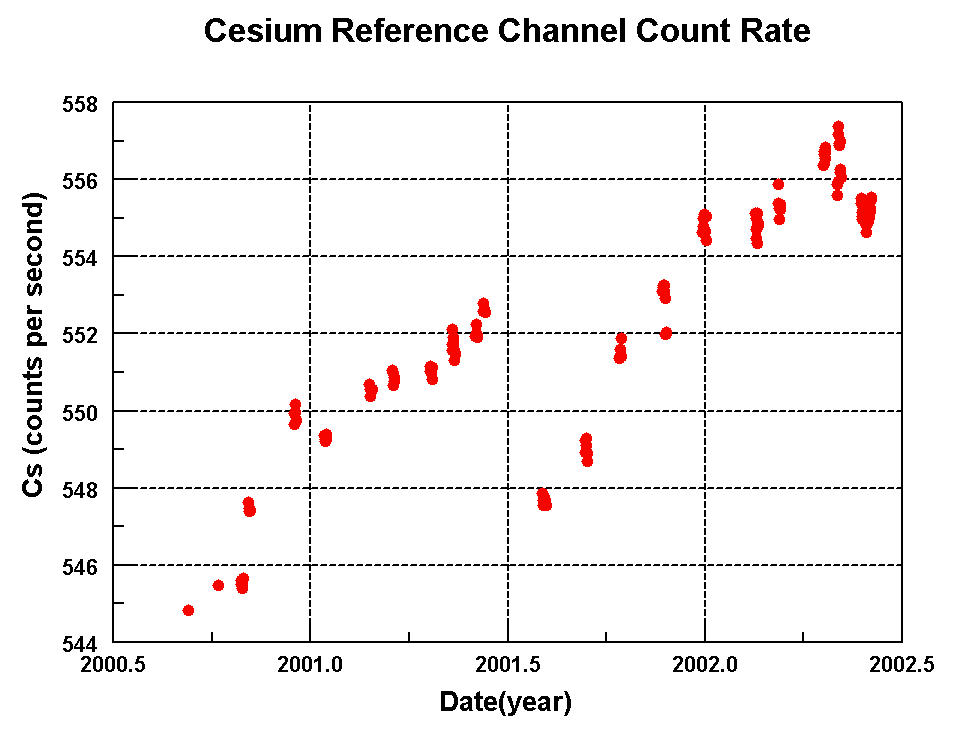
Figure 1: Cs137 background count rates vs. Time
Figure 2 shows the background count rates for the K40 channel. The data do not demonstrate any clear long term trends. A close examination of the consecutive measurements does suggest that the background count rates vary linearly over periods of a few days. The largest variations are about 130 counts per hour. A count rate of 130 counts per hour corresponds to about 0.03 percent K for a 600 gram sample.
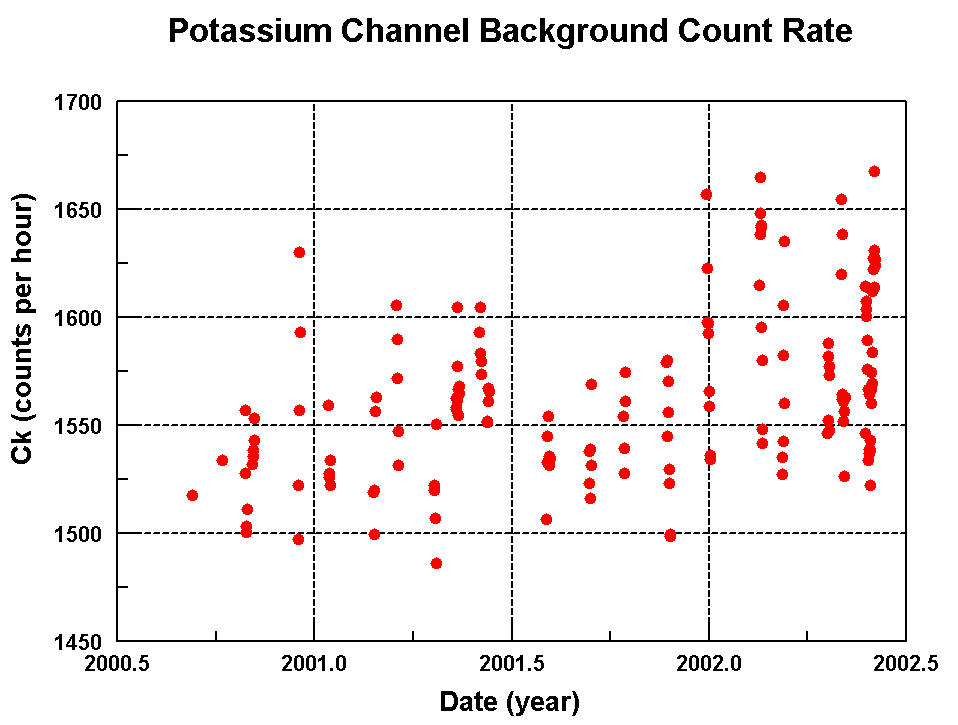
Figure 2: K40 background count rates vs. Time
Figure 3 show the background count rates for the Bi214 (uranium decay series) channel. These data are very similar to the K40 data with maximum variations on the order of 80 counts per hour over a period of a few days. A count rate of 80 counts per hour corresponds to about 0.2 ppm eU for a 600 gram sample.
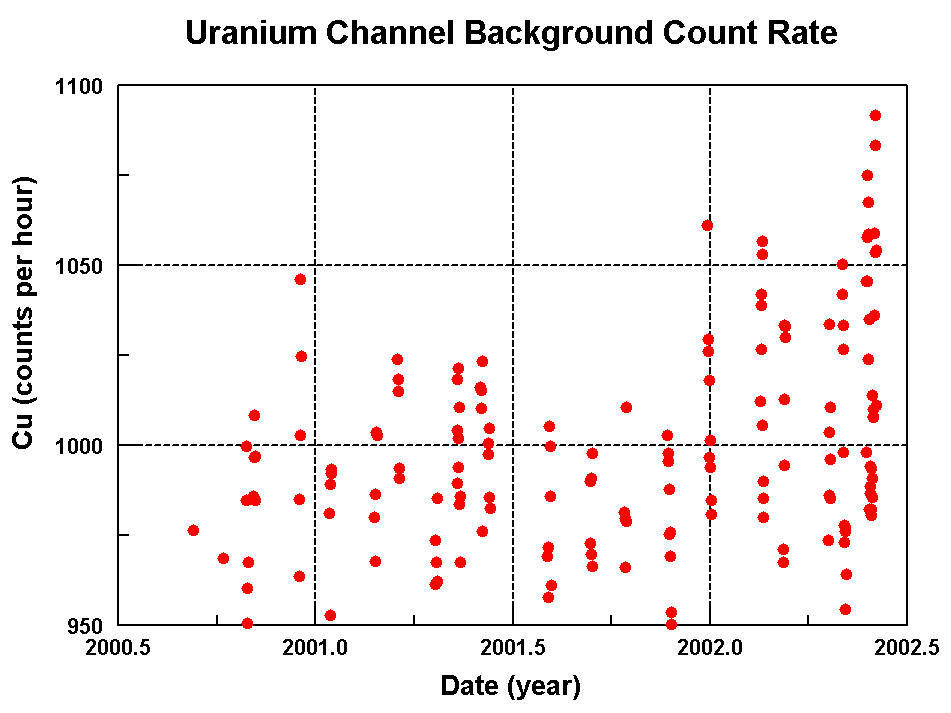
Figure 3: Bi214 background count rates vs. Time
Figure 4 shows the count rates for the Tl208 (thorium decay series) channel. These data are also very similar to the K40 data with maximum variations on the order of 80 counts per hour over a period of a few days. A count rate of 80 counts per hour corresponds to about 0.7 ppm eTh for a 600 gram sample.
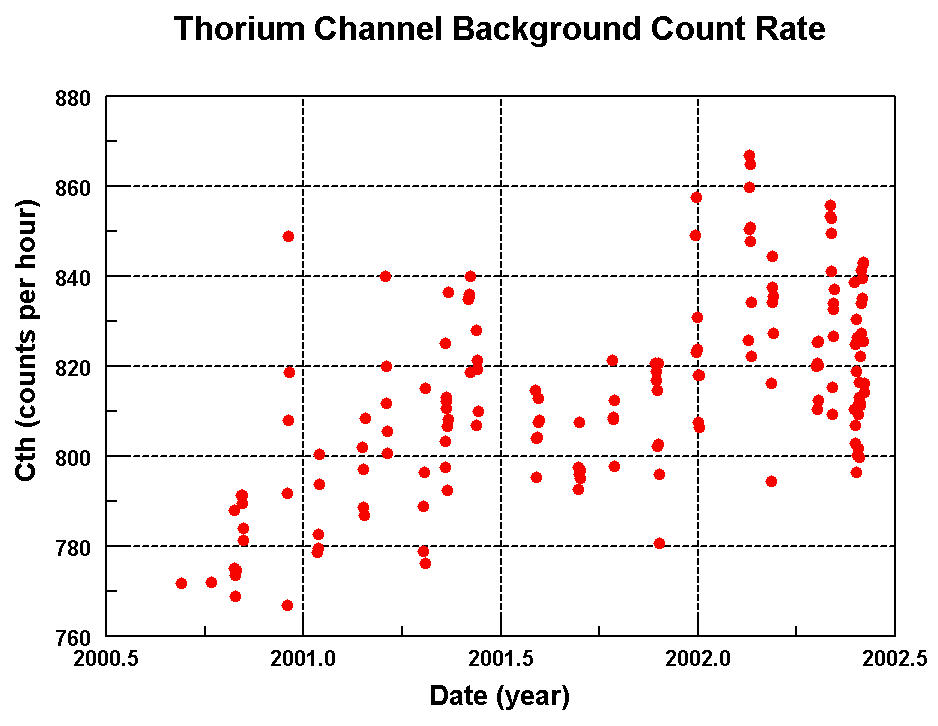
Figure 4: Tl208 background count rates vs. Time
Data for Some USGS Rock Standards Acquired from Gamma-ray Castle
The figures below show the calibration equations in graphical terms as a means of comparing the calculated values versus the "known" values for some USGS rock standards. CKn, CUn, and CThn are the count rates after background correction and normalized to counts per hour per 600 grams of sample material.
The equations are:
1) K = A * CKn + B * CUn + C * CThn
Parameters After Fitting:
A = 0.000223
B = -0.000157
C = -0.000072

Figure 5: Calculated Potassium Values vs. Known Potassium Values
(Click on image to view larger image in new window)
2) eU = A * CKn + B * CUn + C * CThn
Parameters After Fitting:
A = -0.0000083
B = 0.00252
C = -0.00062

Figure 6: Calculated Uranium Values vs. Known Uranium Values
(Click on image to view larger image in new window)
3) eTh = A * CKn + B * CUn + C * CThn
Parameters After Fitting:
A = -0.000003
B = -0.000164
C = 0.00854

Figure 7: Calculated Thorium Values vs. Known Thorium Values
(Click on image to view larger image in new window)
Top || Introduction || Software || Hardware || Construction || References || Photos || Data
For more information about this report contact: Stephen
L. Snyder or Joseph S. Duval
[an error occurred while processing this directive]