Digital Mapping Techniques '03
— Workshop Proceedings
U.S. Geological Survey Open-File
Report 03–471
Portable Software Tools for Managing and Referencing Taxonomies
U.S. Geological Survey and
University of California Santa Barbara, Santa Barbara, CA 93106
Telephone (805) 893-3663; fax (805) 893-8617; e-mail: jordan@geog.ucsb.edu
Abstract
Much of scientific enterprise is concerned with categorization of phenomena. Categorization schemes, also known as taxonomies, are of three types: flat, hierarchical (singly-nested), or hetrarchical (cross-nested, or correlated). Only flat schemes are easily represented in traditional database management systems and their associated user interface systems. Hierarchies and hetrarchies require additional key fields and/or tables to encode the nesting; these artifacts are obtuse both in the database and on forms. Described here is a portable spreadsheet application, Science Language Interface Module (SLIM), and a companion user interface widget, Tree-Box, that facilitate management of and reference to taxonomies in relational databases, making use of well-established graphical and textual notations for nesting. Limitations of these simple software tools also are discussed, along with suggestions for their future development.
1. Introduction
Phenomena in the real world demonstrate amazing variety. To deal with this variety, the human mind has evolved an exquisite capacity for categorization. We rapidly learn to distinguish parents from strangers, bread from bricks, sunsets from firestorms. As the categories become increasingly numerous and subtle, we repeatedly reapply the conceptual process to the categories themselves, thereby achieving hierarchical structures. The Linnaean system in biology and the geologic time scale are two well-known examples of such categorization schemes, or taxonomies.
Still, because of their variety, real-world phenomena may not fit clearly and cleanly into any fixed taxonomy. The duck-billed platypus, for example, begs to be included in multiple categories, as do many geological phenomena, such as fossil casts (both biologic and lithologic records) and tufa rock (arguably both igneous and sedimentary material). In reality, such hetrarchical phenomena are the exceptions that prove the rule of their strict hierarchical brethren, which can be neatly categorized.
Curiously, the computer systems that have gained wide acceptance over the past few decades—particularly the relational database management systems—do not directly support taxonomies. The disparity between messy real-world phenomena and flat, neat database tables is, in fact, extreme. With programming, this disparity can be masked somewhat, but the computational gestalt is at odds with much of the scientific enterprise.
This article is structured as follows: Section 2 presents a review of relational database technology and outlines how taxonomic organization can be implemented on top of it; Section 3 presents a textual representation of taxonomies that is convenient for both humans and databases; Section 4 describes a software package for managing taxonomies, implemented as a MicrosoftTM Excel spreadsheet application; Section 5 describes a companion TreeBox “widget” that can be used to explore/select from taxonomies in user-written applications; and Section 6 offers some self-assessment and directions for future work
2. Relational Database Technology and Taxonomic Representation
A relational database (RDB) is an organized and integrated collection of data maintained in the formal mathematical structure of relations (Codd, 1970). A relation is an unordered collection of tuples, each of which is a fixed-length list of co-occurring values for atomic properties, or attributes. Conventionally, relations are represented in tables: tuples correspond to rows, and property names (or more generally, property domains) correspond to columns. The actual attributes are recorded literally in the table cells. Tables are not relations, however, since they have fixed row and column orderings; also, cells may be left empty (to indicate missing or null values), which is intractable mathematically.
A relational database management system (RDBMS) is computer software that implements and supports one or more RDBs, commonly providing both programmatic access to them and an over-arching graphical user interface (GUI). RDBMSs concern themselves with many practical details of multi-user and multi-site access to RDBs, including concurrency, networking, security, etc. For an excellent overview as well as in-depth treatment of RDMBS topics, see Date, 2000.
It is difficult to represent even relatively simple real-world subject matter in a single RDB table; rather, a number of inter-related tables are used. The relationships between tables are entirely different from the relations represented within the tables themselvesča common point of confusion for database practitioners at all levels. The most common relationship between two tables, an (equi)join, is established by matching attribute values of selected columns, called keys, between them. The matching rows from the tables participating in such a join effectively create “super-rows” of attributes from both tables, usually showing the matched key only once. For each super-row in the output table there can be zero, one, or many matching rows in each of the input tables. For the “one-to-one” and “one-to-many” cases, the joined attributes can be appended to existing rows in one table or the other; however, the “many-to-many” case, which in practice is the most frequent, requires an intermediary third table to be represented (Date, 2000, p.76), adding substantial complexity.
Relational table structures are lionized as a means of modeling the real-world because, in theory, they permit individual facts (relations) to be stated only once—“the truth, the whole truth, and nothing but the truth, so help me Codd”, as wags like to put it. However, the price for this pulverization of reality is high: much “relational work” is required to reassemble reality according to the matching keys between all the little tables of facts.
In truth, the RDB paradigm is reasonably well-suited to fiat realities, such as bank accounts and business transactions; it is a much poorer fit for real-world phenomena, which are characteristically dynamic, imprecise and subjective. Practically all of geoscience is this way! Nevertheless, RDBs are made to work, for better or worse, because other database approaches, such as object-orientation and markup languages, are still too experimental, expensive, or distant from existing desktop applications to be viable alternatives.
Fortunately, taxonomies address a fiat categorization of real-world phenomena rather than the phenomena themselves, so these are structures that can be nicely modelled in an RDB. Three kinds of taxonomy will be considered here:
Evidently, a flat list is directly realized in a flat table. A hierarchy, with its restriction to single nesting, can be represented by a self-related table, in which each entry except the top-most “links up” to its parent as shown in figure 1a. A hetrarchy requires two tables, one to record the basic terminology (nodes), as for flat lists and hierarchies, and the other to explicate their inter-relationships (links). Among several representations for hetrarchy, Brodaric and others (2002) make a cogent argument for the most verbose option, where each node is explicitly linked to all of its ancestors right up to the top(s) of the structure; their example is reproduced as figure 1b. This “ancestor tree” notation also facilitates generalization to higher taxonomic levels, for both hierarchies and hetrarchies.
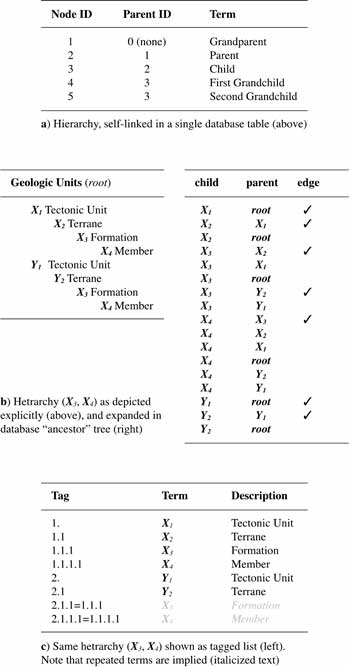 |
Figure 1. Taxonomic representations. |
3. Textual Representation of Taxonomies
The RDB representation of taxonomies is serviceable in a computer application but hardly succinct for everyday use, especially publication, since its interlinking key structures are obtuse. Instead, for many centuries, humans have used “dotted number” tags (sometimes dotted letters or even dotted Roman numerals) to indicate hierarchical structures, especially outline structure in documents. The outline of this article, for example, is flat: 7 numbered Section headings. The North American Stratigraphic Code (American Association of Petroleum Geologists, 1983) by contrast, has a 6-level structure, in which only some levels are tagged (bolded):
PART II: ARTICLES
FORMAL UNITS DISTINGUISHED BY CONTENT, PROPERTIES, OR PHYSICAL LIMITS
LITHOSTRATIGRAPHIC UNITS
Nature and Boundaries
Article 22. Nature of Lithostratigraphic UnitsFollowing on from Johnson and others (1999), Johnson (2002) has specified a dotted-number tagged hierarchy for classifying rock units on geological maps, part of which is shown in table 1 and used in subsequent examples. The tags prefixing the term names and descriptions are arbitrary.
| Table 1. Portion of a lithologic hierarchy | ||
|
Tag
|
Term
|
Description
|
|---|---|---|
|
1.
|
Unconsolidated
|
A sediment that is loosely arranged or unstratified . . .
|
|
2.
|
Sedimentary rock
|
A rock resulting from the consolidation of loose. . .
|
|
2.1.
|
Clastic rock
|
A rock composed principally of broken pieces. . .
|
|
2.1.1.
|
Mudstone
|
A general term that includes claystone, siltstone, . . .
|
|
2.1.2.
|
Fine-grained mixed clastic
|
A mixture of clastic sedimentary rocks varying. . .
|
|
2.1.3.
|
Sandstone
|
A medium-grained clastic sedimentary rock . . .
|
|
2.1.4.
|
Medium-grained mixed clastic
|
A mixture of clastic sedimentary rocks varying . . .
|
|
2.1.5.
|
Conglomerate
|
A coarse-grained clastic sedimentary rock . . .
|
|
2.2.
|
Carbonate
|
A sedimentary rock composed of more than 50%. . .
|
|
2.2.1.
|
Limestone
|
A sedimentary rock consisting chiefly of calcite
|
|
2.2.2.
|
Dolostone
|
A sedimentary rock consisting chiefly of dolomite
|
|
etc.
|
||
The textual representation using dotted-number tags is compact and convenient both for computer work and for human communications; it also serves well as an interchange (import/export) format between computers and/or database systems. A tagged taxonomy file contains lines of text that are identical to the rows of table 1, prefixed by the name of the taxonomy. Such files can be easily loaded into or dumped from the RDB formats discussed above.
To accommodate hetrarchy, I extend this notation to equated tags, or simply equates. Where a term has two or more tags, it occurs at multiple locations in a hierarchy—therefore a hetrarchy—simultaneously. Equates are given only with derivative occurrences of a term; the principal occurrence exists stand-alone. For example, the expression “2.1 = 1.2.3 Tufa: A chemical sedimentary deposit from geothermal water. . .” indicates that tufa occurs derivatively in the 2. . .hierarchy (perhaps as an igneous material) and also primarily in the 1 . . . hierarchy (as a chemical sedimentary material). Multiply derivative equates also are permitted, e.g. “2.3 = 2.1, 2.2 Mixed Clastic/Carbonate. . .” Equated entries within a taxonomy may occur at parallel or different levels and may contain the same or different text (term names and/or definitions); i.e., equates strictly address structure, not content. As a complete example, one rendition of the Brodaric and others (2002) hetrarchy is shown in figure 1c.
4. Maintaining Taxonomies
The tagged taxonomy notation is easily managed in word-processing and spreadsheet software. MicrosoftTM Excel is particularly useful for editing taxonomies since it interfaces well with RDBs such as MS Access (or any ODBC-compliant RDB, in fact) and a wide variety of other desktop applications. The Science Language Interface Module (SLIM) is just such an Excel application, written for the National Geologic Map Database Project (NGMDB) to facilitate its work with the many geoscience taxonomies that underlie geological maps. The SLIM software is available for demonstration and download from the NGMDB Web site http://ncgmp.usgs.gov/ngmdbproject/, under the tools submenu.
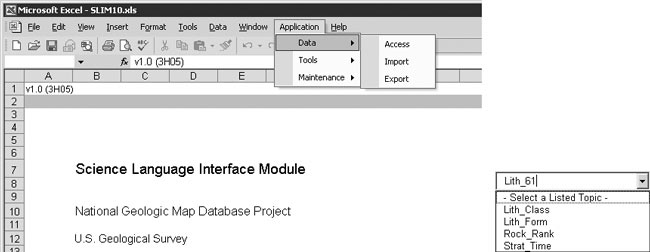
On startup, SLIM displays its “cover sheet” (figure 2a), from which the application is controlled via the [Application] pad that appears at the right end of the Excel menu bar. Selections from this drop-down menu lead in general to sub-menus and/or dialog boxes, which are intended to be self-explanatory. For example, the Data|Access choice prompts to open a connection to an MS Access database that contains (or will be updated to contain) standard taxonomy and ancestor tree tables (per Section 2). Data|Export and Data|Import perform transport between a pre-connected database and tagged taxonomy text files (per Section 3). All menu choices are described in on-line help.
|
| a) Application “cover sheet” |
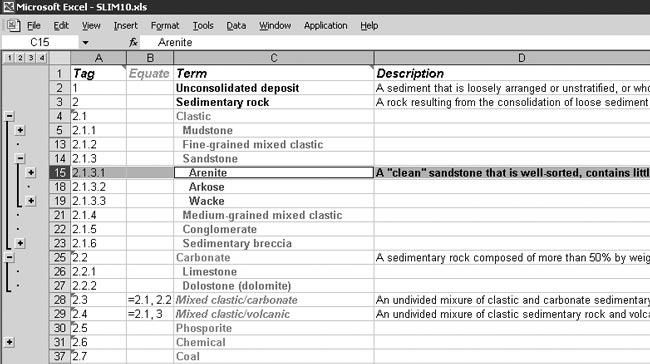 |
| b) Editing tableau |
| Figure 2. SLIM interface. |
Once a database connection has been established, SLIM lists the names of the (usually multiple) taxonomies it contains in a drop-down box (figure 2a, lower center). Selecting one of these names causes the corresponding taxonomy to be generated on an additional worksheet, which also serves as its editing tableau (figure 2b). Tags appear in column A, any equates in column B, the defined term names in column C, and free-text descriptions (optional, but strongly encouraged) in column D. Edits to cells other than the tags are freely allowed; in addition, full rows may be cut-and-pasted within a taxonomy worksheet, or between worksheets, with automatic recalculation of tags (and equates, if necessary). These edits are immediately reflected in the internal cache and also updated to the connected database when it is closed.
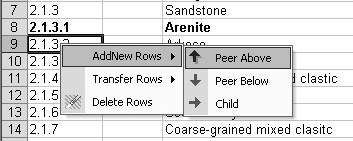
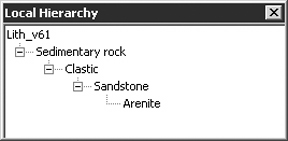
Right-clicking in a cell may present a popup display, depending on the cell’s column. From the Tag column, addition/deletion and transfer of terms is supported (figure 3a); and from the Term column, the local hierarchy associated with the term is shown (figure 3b). These same options are also available from the [Application] pad on the Tools submenu (not shown).
 |
 |
|
| a) Row editing (Tag column) | b) Local hierarchy (Term column) | |
| Figure 3. SLIM interface popups. | ||
To facilitate editing in hetrarchies, several conventions apply. Derivative rows are shown italicized (figure 2b, bottom) vs. roman font for principal rows (as for flat and hierarchical taxonomies, all rows of which are principal). Rows may be converted from principal to derivative, and vice versa, simply by adjusting their equates; however, a row must remain principal, and also cannot be deleted, so long as it has any derivatives. Finally, when a new derivative row is added, it automatically copies up the (first) principal row’s term name and description, which subsequently may be edited.
5. Referencing Taxonomies (The Tree-Box Widget)
Constructing taxonomies is, thankfully, only an occasional chore. Once constructed, good taxonomies can ease regular day-to-day tasks by providing hierarchical “pick-lists” that both speed up and standardize data entry and editing. For this purpose, SLIM includes a companion widget, called Tree-Box, which can be used to access its taxonomies from other applications. Only browsing and selection are allowed in Tree-Box, not editing.
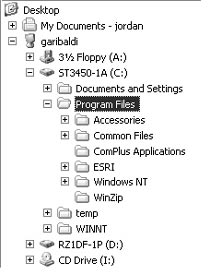
The now well-established representation of hierarchies is a “tree-view”, viz. the left-hand pane of WindowsTM Explorer (figure 4a). In a tree-view, terms are appropriately indented, and [+] and [-] icons are provided for opening and closing, respectively, branches of the tree. Other established semantics include double-clicking terms in the tree to expand/collapse them, and right-clicking them to pop up auxiliary menus.
 |
 |
|
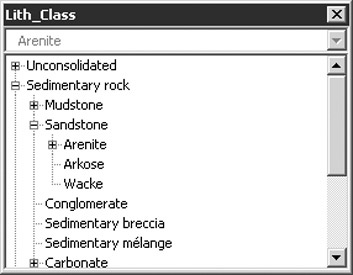
| a) Windows Explorer | b) SLIM Tree-Box widget | |
| Figure 4. Hierarchies as trees. | ||
A miniaturized version of such a tree-view has been grafted onto a “combo-box” to make SLIM’s Tree-Box widget (figure 4b). Tree-Box is implemented as an ActiveX control (Stephens, 1998) so that it can be easily embedded in MS Office™ applications or any similarly ActiveX-aware software, such as ESRI ArcGIS™. The relevant database connection can be set via Tree-Box’s property pages at design-time and/or scripted at run-time. Subsequently, navigation of the selected taxonomy is under user control; any “picks” from it are returned to the host application as ordinary text strings.
Describing the behavior of Tree-Box is actually more complicated than using it. When closed, Tree-Box looks like an ordinary combo-box, which it is. Upon clicking the drop-down button, however, a tree-view pane is presented rather than a flat list; this can be navigated by the usual [+] and [-] icons, right-clicking, etc. Left-clicking on a node in the tree-view pops its name into the combo-box, and simultaneously closes the drop-down; to confirm selection of the entry, a carriage-return is required. Alternatively, double-clicking in the tree-view pane, while open, selects and confirms a node selection in one step. Pressing ESCape at any time reneges the current operation, and Control-Z performs a full “undo” (single level).
A demonstration of Tree-Box is incorporated into the SLIM application (figure 5); the stand-alone Tree-Box widget, as a self-registering .ocx file, also is available from the tools folder of the NGMDB project Website.
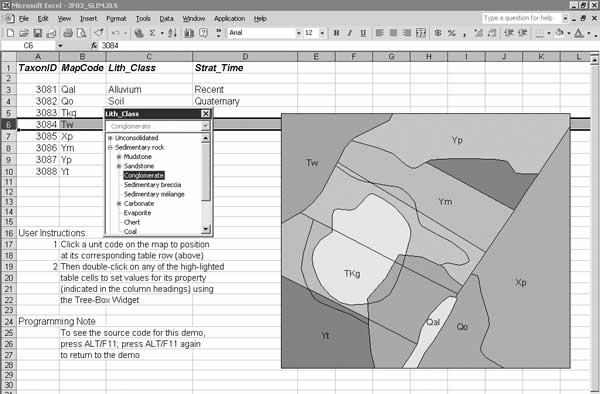 |
Figure 5. Tree-Box demonstration, in SLIM. |
6. Assessment and Future Work
Taxonomies and taxonomic thinking are endemic in the geosciences. It seems curious, therefore, that relatively simple tools like SLIM and Tree-Box are not more widely established. On the other hand, taxonomies (particularly in their hetrarchical form) are not straightforward to represent in a RDB; they also can become unwieldy in spreadsheet and word processing applications without database support. Taken together, the size and complexity of taxonomies can be daunting.
SLIM and its companion Tree-Box widget provide only a beginning point, not yet a compete system, for taxonomic processing. Important features not provided include:
Auto-completion and change tracking/versioning are essentially technical matters; cross-walking and dynamic extensions/personalization embed theoretical issues as well. The progress of science and language are clearly inter-related. Brodaric and Hastings (2002) argue that the relations are bidirectional, in fact. Specifically, the recognition and naming of new or different phenomena in the real-world eventually stimulates updated categorizations, for example, the recently-discovered sub-glacial lakes in Antarctica; while simultaneously, the naming conventions of established categorizations help focus attention on essential generalities and away from proprietary specifics, for example Munsell color (Munsell, 1946) vs. the plethora of other representations, RGB, HSV, CYMK, etc.
Finally, it is evident that the knowledge endeavor draws from many sources, many theories and many terminologies concurrently. A single taxonomy is rarely sufficient by itself, but tends to be inter-articulated and inter-constrained with other assertions of fact. For example, sedimentary grain size is a central axis of understanding for clastic rocks, but hardly relevant for chemical deposits; texture terms take precedence over composition terms for some types of rocks but not others. Encoding this kind of peri-taxonomic information is essential to the scientific process, even as the individual taxonomies are. Such ontologic considerations are beyond the scope of taxonomies per se, but are interwoven with them and through them.
In keeping with this self-assessment, SLIM and its Tree-Box widget have been made as simple as possible, initially, to learn from actual use what sophistications are needed/wanted. I welcome feedback concerning these prototype tools, especially suggestions for their improvement.
7. References
American Association of Petroleum Geologists, 1983, North American stratigraphic code: American Association of Petroleum Geologists Bulletin, v. 67, no. 5, p. 841–875, http://www.agiweb.org/nacsn/code2.html.
Brodaric, B., Boisvert, E., and Patera, A., 2002, A set-theoretic technique and software for managing multiple-classification in geological hierarchies, in Eighth Annual Conference of the International Association for Mathematical Geology, Berlin, Germany, September 15–20, 2002.
Brodaric, B., and Hastings, J., 2002, An object model for geologic map information, in Advances in Spatial Data Handling: Tenth International Symposium on Spatial Data Handling, Ottawa, Canada, July 9–12, 2002, p. 55–68.
Codd, E.F., 1970, A relational model of data for large shared data banks: Communications of the Association for Computing Machinery, v. 13, no. 6, p. 377–387.
Date, C.J., 2000, An introduction to database management systems (7th ed.): Reading, Massachusetts, Addison-Wesley, 938 p.
Johnson, B.R., 2002, “Geologic map unit classification ver. 6.1”, at http://geology.usgs.gov/dm/
Johnson, B.R., Brodaric, B., Raines, G.L., Hastings, J.T., and Wahl, R., 1999, Digital geologic map data model ver. 4.3, http://geology.usgs.gov/dm/model/Model43a.pdf.
Munsell, A.H., 1946, A color notation (10th ed.): Baltimore, Maryland, Munsell Color Company, 74 p.
Stephens, R., 1998, Custom controls library: New York, New York, Wiley, 684 p.