 |
|
|
||||
| Open-File Series 03-037: Data Files Readme and Examples |
Homepage | Readme | Table of Contents | Data Files Readme | Glossary |
The two sets of data that are located in the appendices are porperm.xls and HI_TOC.xls. All data files are saved in Microsoft EXCEL version 5.0 as v97 and 5.0/95 Workbooks, as space-delimited files (*.prn), and comma-delimited data (*.csv). File contents and examples are shown and explained below.
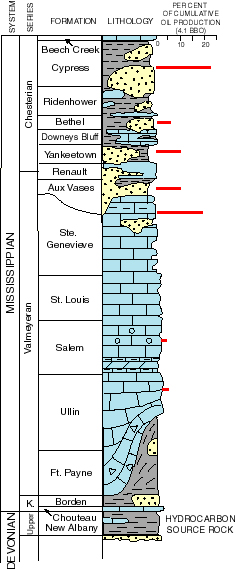
Table 1. Below is a sample from the porperm.xls file that is located in appendix 1. The data are also saved as comma-delimited ( porperm.csv ) and space-delimited ( porperm.prn ) formats. Files are located in the "data" sub-directory. Three-hundred and seventy-seven core reports were used to determine median values of porosity, permeability, and the percent oil and water saturation for cored intervals of the following Mississippian-age formations: the McCloskey unit of the Ste. Genevieve, Aux Vases, Bethel, and Cypress. Figure 7 is a stratigraphic column that shows these formations. Percents of oil and water saturation are generally inaccurate due to water washing and/or contamination of the core during drilling and recovery.
VARIABLES FOR PORPERM FILES ARE:
|
ID |
Longitude |
Latitude |
Form |
Depthft |
Hperm |
Porosity |
%Oil |
%Water |
Well Name |
Field Name |
TRS |
|---|---|---|---|---|---|---|---|---|---|---|---|
|
RI-3A |
-88.070 |
38.768 |
AXVS |
2966 |
17.70 |
6.5 |
62.00 |
University #1 |
Sec. 23-4N-10E |
||
|
209Pos7 |
-87.965 |
38.213 |
AXVS |
2843 |
15.10 |
12.0 |
44.10 |
No. 5 |
Griffin |
3-14W-4S |
|
|
EDW-1B |
-88.014 |
38.472 |
BTHL |
2938 |
128.0 |
15.95 |
15.0 |
41.00 |
Tarplay No. 1 |
Wildcat |
31-1N-14W |
|
WA-3B |
-87.753 |
38.440 |
BTHL |
2190 |
15.70 |
15.5 |
36.50 |
E.A. Viehman #1 |
Wildcat |
Sec. 9-1S-12W |
|
|
WAB-2C |
-87.901 |
38.276 |
CPRS |
2520 |
3.8 |
18.70 |
21.6 |
42.70 |
Mary Heil #15 |
Schuhbend |
Sec. 7-3S-13W |
|
MAD-1C |
-89.903 |
38.693 |
CPRS |
1581 |
89.0 |
19.60 |
21.1 |
38.60 |
Leighty #3 |
Billett |
20-3N-7W |
|
JAS-2M |
-88.123 |
38.941 |
MCLK |
2849 |
771.0 |
16.70 |
12.0 |
25.00 |
Dee #1 |
North Boos |
Sec. 20-6N-10E |
|
WAY-7M |
-88.658 |
38.393 |
MCLK |
3103 |
2.3 |
15.30 |
17.0 |
40.60 |
Cecil Tyler 1 |
Keensville |
1S 5E Sec 33 |
Table 2. The below sample from the HI_TOC files, located in appendix 2, shows geochemical statistics for samples from the New Albany Shale. HI_TOC.xls file is saved in Microsoft EXCEL version 5.0 as v97 and 5.0/95 Workbook. The file is also saved in space-delimited (HI_TOC.prn) and comma-delimited formats (HI_TOC.cvs). Analytical methods are detailed and assessed in Lewan et al. (1995, 2002), and very briefly summarized here. Total organic carbon content (TOC) of hydrocarbon source rocks is primarily determined using Rock-Eval pyrolysis. This technique involves heating about 50 to 150 mg of powdered rock in a crucible under anhydrous conditions. The oven is continuously swept by flowing helium at low pressures, and the sample is heated isothermally, followed by a programmed rate of heating. Pyrolysis of the sample at a constant temperature of about 250 degrees C for 3 to 5 minutes distills organic compounds from C1 (one carbon atom and attached hydrogen atoms) to about C32. Volatilized products are swept with helium into a flame ionization detector (FID) for quantification of contained hydrocarbons. These pyrolyzed hydrocarbons are considered to be bound to the organic matter in the sample and are designated as "S1" (S subscript 1) hydrocarbons. Programmed heating from 250 to 600 degrees C at a rate of 25 degrees C/minute cracks the kerogen and heavy bitumen. This yields organic compounds, water, carbon dioxide, and other gases. Half of the flow of produced molecules is sent to the FID to measure hydrocarbon compounds; these are designated "S2" (S subscript 2), generated hydrocarbons. The other half of the flow is sent to a carbon dioxide trap that is heated at 250 to 390 degrees C. Compounds in the carbon dioxide trap are heated and resulting gas is measured by a thermal conductivity detector (TCD); these hydrocarbons are designated as "S3" (S subscript 3). Evolved carbon monoxide (CO) is not measured. The crucible is then moved to another furnace where it is heated to about 590 degrees C in air (oxidizing atmosphere). The evolved carbon dioxide is measured by the TCD.
VARIABLES FOR HI_TOC FILES OF THE NEW ALBANY SHALE ARE:
|
State |
Latitude |
Longitude |
Tmax |
PI |
TOC |
HI |
Sample_Number |
Sample_ID |
|---|---|---|---|---|---|---|---|---|
|
IN |
38.801 |
-85.856 |
431.1 |
0.04 |
7.55 |
667.6 |
1 |
94001002 |
|
IN |
38.252 |
-85.854 |
432.1 |
0.04 |
7.02 |
652 |
2 |
94001013 |
|
IN |
38.963 |
-87.496 |
439.4 |
0.07 |
5.81 |
502.4 |
3 |
94001023 |
|
IN |
38.017 |
-85.941 |
434.3 |
0.05 |
6.43 |
659.5 |
4 |
94001033 |
|
IL |
37.524 |
-88.379 |
452.2 |
0.14 |
4.83 |
73.8 |
5 |
94001038 |
|
IL |
37.528 |
-88.354 |
457.6 |
0.07 |
6.91 |
65.2 |
9 |
94001066 |
|
KY |
36.804 |
-87.945 |
440.3 |
0.02 |
5.67 |
490.5 |
7 |
94001049 |
|
KY |
37.252 |
-86.022 |
435 |
0.04 |
11.6 |
519 |
280 |
5 Louisa Puckett |
|
KY |
36.895 |
-87.578 |
435 |
0.04 |
7.95 |
551 |
281 |
1 Jewell Hill |
Homepage | Readme | Table of Contents | Data Files Readme | Glossary |
| AccessibilityFOIAPrivacyPolicies and Notices | |
 |
|