An Account of Preliminary Landslide Damage and Losses Resulting from the February 28, 2001,
Nisqually, Washington, Earthquake
By Lynn M. Highland
This report is preliminary and has not been reviewed for conformity with U.S. Geological Survey editorial
Standards or with the North American Stratigraphic Code.
Any use of trade, firm, or product names if for descriptive purposes only and does not imply endorsement by the U.S. Government.
Open-File Report 03-211
U.S. Department of the Interior
U.S. Geological Survey
CONTENTS
Abstract
Introduction
General Information on Landslide
Loss Assessment
Methodology
Categories
of Landslides
Direct vs.
Indirect Costs
Public vs. Private
costs
The Complexity
of Obtaining Accurate and Complete Landslide Loss Data
Privacy
Issues
Profile of the Nisqually Earthquake
Significant Landslides Caused
by the Nisqually Earthquake
Overview
Table
1
Figure
1
Salmon
Beach landslide
Cedar River Landslides,
City of Renton
Capitol Lake/Deschutes
Parkway
Maplewild
Avenue landslide, City of Burien
Tolmie State
Park
Sunset Lake/Trosper Memorial
Trailer Park, Near
Tumwater
U.S.
Highway 101, Thurston County
36th
Street, West Seattle
The
Alaskan
Way Viaduct
Other Areas of Landslide Damage
Other Highway Damage
Conclusions
Recommendations for Future Study
Acknowledgements
References
APPENDIX A – Detailed Reports
of Damage Assessments
APPENDIX B – Preliminary Total
Estimated Losses for the Nisqually Earthquake
| Figures | ||||||||||||
| 2 | 3 | 4 | 5 | 6 | 7 | 8 | 9 | 10 | 11 | 12 | 13 | 14 |
| 15 | 16 | 17 | 18 | 19 | 20 | 21 | 22 | 23 | 24 | 25 | 26 | 27 |
Abstract
The February 28, 2001, Nisqually, Washington, earthquake (Mw = 6.8) damaged an area of the northwestern United States that previously experienced two major historical earthquakes, in 1949 and in 1965. Preliminary estimates of direct monetary losses from damage due to earthquake-induced landslides is approximately $34.3 million. However, this figure does not include costs from damages to the elevated portion of the Alaskan Way Viaduct, a major highway through downtown Seattle, Washington that will be repaired or rebuilt, depending on the future decision of local and state authorities. There is much debate as to the cause of the damage to this viaduct with evaluations of cause ranging from earthquake shaking and liquefaction to lateral spreading to a combination of these effects. If the viaduct is included in the costs, the losses increase to $500+ million (if it is repaired) or to more than $1+ billion (if it is replaced). Preliminary estimate of losses due to all causes of earthquake damage is approximately $2 billion, which includes temporary repairs to the Alaskan Way Viaduct. These preliminary dollar figures will no doubt increase when plans and decisions regarding the Viaduct are completed.
Introduction
The Nisqually Earthquake shook much of western Washington State on the morning of February 28, 2001, and caused widespread damage, much of which resulted from ground failure. This report presents a description and tabulation of damage and monetary losses caused by earthquake-induced landslides resulting from the earthquake. The Nisqually earthquake caused many types of ground failure, however, for the purposes of this study, only those instances that can be classified as landslides according to the movement types recognized by Cruden and Varnes (1996) will be noted. These include falls, topples, slides, spreads, flows, and combinations thereof. Liquefaction effects are not reported here, as they are generally considered an earthquake effect and not a landslide process. It should be noted that some areas experienced liquefaction and lateral spreads and other ground failures in close proximity.
Landslide inventories, locations, and some descriptions were taken from unpublished field notes provided by the Federal Emergency Management Agency (FEMA) and from unpublished reconnaissance reports of the United States Geological Survey (USGS). Both agencies had personnel in the field within one or two days of the earthquake, who performed thorough field inspections of earthquake and landslide effects. Additional information was provided by a National Science Foundation-sponsored unpublished report (Bray and others, 2001). Most unpublished information is currently on Internet sites that are referenced where applicable, throughout this report. However, long-term availability is uncertain, as many entities archive their Internet information onto different sites and addresses after certain lengths of time.
The USGS and FEMA supported this investigation with the goal of providing a framework for assessing future losses from earthquake-induced landslides as well as other types of landslides and as timely documentation of losses for future research. Loss assessment of natural hazard damage is a crucial aspect of the cost/benefit evaluations that are needed for mitigating landslide hazards. Losses due to landslides are not routinely compiled for most events, as they are difficult to ascertain for reasons cited later in this report.
As loss studies for landslides are so seldom performed, this report begins with a section on loss assessment methodology and definitions. Next, the earthquake is briefly described, along with the landslides it caused and their associated damages and costs. Appendix A includes a detailed description of landslide effects and monetary losses, and Appendix B presents a summary description of the total damage and losses from all effects of the Nisqually Earthquake.
All loss figures reported here are direct losses and do not include indirect losses, such as calculations of losses from business revenue due to landslide-damaged roadways. (Aspects of direct and indirect losses are discussed in the Loss Assessment Methodology section of this report.) All loss figures are preliminary and unless otherwise noted, have been converted to year 2002 dollars. These conversions were made using the Gross Domestic Product (GDP) Deflator Inflation index. This inflation calculation is based on the inflation rate during the US Government fiscal year, which begins on October 1 and ends on September 30.
The report is incomplete in the sense that some damage assessments are continually being evaluated and reassessed and have not been entirely completed for all areas. Some of the highway damage assessment is ongoing and changing, as differing repair and reconstruction scenarios continue to be evaluated by local officials. Financial losses reported here are necessarily preliminary and subject to change. It must also be noted that not all monetary losses have been reported because there are numerous privacy issues concerning some of the damage, and, as a result, data are unavailable.
General Information on Landslide Loss-Assessment Methodology
Landslide loss assessments are few and far between, as the reasons for their inherent difficulty are outlined as follows, in this section. However, there have been several successful efforts most notably those by Fleming and Taylor (1980) and by Schuster and Fleming (1986). This report is similar in approach to that detailed in Fleming and Taylor (1980).
Landslide-loss data are generally categorized as either
direct or indirect. Other categories include losses suffered by public vs.
private entities and whether the losses are insured or uninsured. Losses
can occur to a geographic region collectively (many, possibly intermingled,
landslides that may affect lifelines and public safety, as well as individual
buildings) or as a single, isolated event that affects a small geographic
area, such as a residential lot.
Direct costs are the repair, replacement, or maintenance resulting from damage to property or installations within the boundaries of the responsible landslides or from landslide-caused flooding (Schuster, 1996). A good example of direct losses from a single major landslide is the Thistle, Utah, landslide of 1983. This 21-million cubic meter (m3) landslide resulted in $200 million dollars in direct damage ($374 million, year 2001 dollars) (University of Utah, 1984). The landslide severed major transportation arteries, and the lake impounded and inundated the town of Thistle and railroad switching yards.
All other costs of landslides are indirect. Some examples of indirect landslide losses are:
1. Loss of industrial, agricultural, and forest productivity and tourist revenues as a result of damage to land or facilities or interruption of transportation systems;
2. Reduced real estate values in areas threatened by landslides
3. Loss of tax revenues on properties devalued as the result of landslides;
4. Measures that are required to be taken, to prevent or mitigate additional landslide damage;
5. Adverse effects on water quality in streams and irrigation facilities outside the landslide;
6. Loss of human or animal productivity because of injury, death, or psychological trauma; and
7. Secondary physical effects, such as landslide-caused flooding, for which losses are both direct and indirect.
Indirect costs may exceed direct costs; unfortunately, most indirect costs are difficult to evaluate and thus are often ignored or, when estimated, are too conservative.
The 1998 Anzar Road landslide which occurred during El Nino-driven storms in San Benito County, California is an excellent example of indirect losses, as well as direct losses. This landslide blocked a road, disrupted traffic, and damaged a house, causing losses which were directly due to the landslide itself—these losses are designated as direct losses. The same landslide broke a gas pipeline, which disrupted natural gas delivery to the city of Santa Cruz, California, shutting down many businesses for three days. This loss of business income, and the fact that the gas company had to relight all pilot lights in the city at great expense, is an example of indirect losses. The Anzar Road landslide is also a good example of the fact that losses from landslides are obtainable where entities involved are willing to share monetary information (Schuster and others, 1998). More often, however, monetary information, being of a discreet nature and in many instances, not public domain, people and entities prefer to leave their losses a private matter.
Landslide losses also can be separated into categories of either public or private. Public costs are those that must be met by government agencies; all others are private costs. The largest direct public costs commonly have been for rebuilding or repairing government-owned highways, railroads and structures such as sidewalks and storm drains. Other examples of direct public costs resulting from landslides are those for repair or replacement of public buildings, dams and reservoirs, canals, harbor and port facilities, and communications and electrical power systems. Indirect public costs include losses of tax revenues, reduction of potential for productivity of Federally managed forests, impact on quality of sport and commercial fisheries, and loss of user fees from affected areas such as National Parks and harbor and port facilities.
Private costs consist mainly of damage to real estate and structures, either private homes or industrial facilities. In the United States, most railroads are privately owned. Severe landslide problems can result in financial ruin for affected private property owners because of the general unavailability of landslide insurance or other means to compensate and distribute damage costs.
There are few instances of insured landslide losses, as most homeowner and commercial insurance does not cover landslides, or, the policies have prohibitively high-priced landslide riders with very high deductibles, so much so as to render them uneconomical to purchase. One exception is Federally subsidized flood insurance, but this type of insurance is available only to those who reside or hold property on Federally designated floodplains. Losses due to landslides or debris flows in conjunction with flooding are generally covered for holders of this type of insurance.
The Complexity of Obtaining Accurate and Complete Landslide Loss Data
Landslide-loss data are generally not tracked or published for several reasons. The lack of insurance for reimbursement does not encourage tracking or reporting. Damage due to landslides is not generally delineated in reports of flood, hurricane, or earthquake events and is usually combined with totals from these hazards; for example, landslide damage totals are not usually labeled separately from damage due to earthquake ground shaking. Thus, the impression is, that earthquake-induced landslides are not a significant concern when looking at damage totals from an earthquake. This is unfortunate, because in some cases, such as the 1964 Alaska earthquake, the primary damage was due to earthquake-induced landslides (Youd, 1978). Fortunately for reporting purposes, in the case of the Alaska earthquake, the damage was so devastating that the losses were described in detail. Hidden costs of landslide damage is common for floods and hurricanes. Landslide damage is not always described in detail in reports of damage assessments, but becomes lost in the flood accounts. This practice of generalizing and merging of cost data does not divulge an accurate picture of landslide impact in the United States.
Another reason landslide cost data are obscure is that cost data from landslide damage to highways, for instance, is often merged with general maintenance costs (such as road grading and clearing) in annual budget reports and these are not labeled or reported as damage due to landslides. There is at this time, no national reporting mechanism for landslide losses, and few states track landslide losses. There is also no uniform cost assessment methodology, as the entire approach is generally ad hoc however, Fleming and Taylor (1980) present a useful methodology, that characterizes a generally complete study. There is also no move afoot to combine and publish public and private landslide losses, as there are so many jurisdictions and no authority or incentive to merge these separate sets of data. There is also no current way of combining or reporting losses to property owners or developers when municipal planning or building departments designate property as too hazardous for building. These loss figures are often brought out in “takings” lawsuits filed by landowners and developers, but cost and loss data are rarely public domain, especially where out-of-court settlements take place.
Federal agencies, such as FEMA that are responsible for assessing and reimbursing (in some cases) losses from hazards, do not usually separate landslide losses from flood or earthquake events, for example. Those victims who apply for assistance from FEMA are required to describe damage in detail, and it is in these reports that details concerning landslides emerge. However, these reports are often difficult to find as they are couched in different departments of FEMA during and after FEMA responses to disasters. Other agencies concerned with disasters often publish loss statistics, but again, these statistics are usually composite totals, organized by jurisdiction, and not by exact cause of the loss.
The researcher relies on the largess of those individuals keeping track of losses and expenses, and their willingness to share information!
Financial losses are a sensitive issue to many individuals and agencies, and there are considerations such as property values that come into play when reporting losses—or not reporting them. Many times, settlements for damages are anonymously transacted and any loss information is sealed in court documents. Such privacy concerns prohibit accurate loss assessments in many instances.
Profile of the Nisqually Earthquake
The Nisqually earthquake (Mw = 6.8) occurred in the Puget Sound area of western Washington on February 28, 2001. The event was similar in mechanism to the earthquakes of April 13, 1949 (Puget Sound earthquake; Mw = 7.1) and the April 29, 1965 (Seattle earthquake; Mw = 6.7)(Bray and others, 2001). The epicenter is shown on the map in Figure 1. The Nisqually earthquake produced strong ground shaking over a wide area and caused damage in the Olympia, Seattle, and Tacoma areas of Washington. In all, 24 counties and 25 Indian reservations were included in a Presidential Disaster Declaration issued for the state on March 1, 2001 (Washington Emergency Military Department, 2002). One fatality is attributable to the earthquake and 400 persons sustained injuries. Observations of liquefaction were widespread in parts of Olympia and South Seattle, and several significant lateral spreads, embankment slides, and landslides occurred. The relatively long duration of the event and the relatively low cyclic resistance of some of the fills in the area are likely causes for the significant liquefaction and ground failure observed for this event (U.S. Geological Survey, unpub. data, 2001, [http://geohazards.cr.usgs.gov/wa/]).
Significant landslides caused by the Nisqually earthquake
Landslides triggered by the Nisqually earthquake were sparsely concentrated yet spread over a wide area. Due to the depth of the earthquake focus and the relatively low intensity of ground shaking, there appeared to be no dense concentration of landslides in any one area; however, the scattered failures that did occur have resulted in considerable impact to people and property. Many landslides occurred in the colluvial soils that mantle the slopes of the many hills in the lowland of Puget Sound; the number of these landslides was no doubt tempered by the unseasonably dry weather that preceded the earthquake (Nisqually Earthquake Clearinghouse Group, 2001).
There were several instances of rock fall in the Puget Sound area. The most notable locations were Mount Si, (near North Bend); on the north side of Highway 410 both east and west of Skykomish; and at a steep road cut about 1 km east of LaGrande on Highway 7 (U.S. Geological Survey, unpub. data, 2001, [http://geohazards.cr.usgs.gov/wa/]). There was also a report of substantial rock fall activity in the crater at Mount St. Helens, Washington (Ed Klimasauskas, written commun., U.S. Geological Survey, February 28, 2001).
Table 1 presents location information and loss data on earthquake-induced landslides that were investigated by the Federal Emergency Management Agency (FEMA), Region X, Nisqually Earthquake Disaster Field Office, which was operational in Olympia, Washington, for several months after the earthquake occurred. Figure 1 shows geographical areas of these landslides based on Global Positioning System (GPS) latitude/longitude data obtained from FEMA and tabulated in Table 1. Some highway damage, as well as other smaller landslides and their accompanying dollar losses are not tabulated here, but are discussed in the text of this report. More detailed and itemized preliminary loss data for each landslide can be found in Appendix A. Note: Measurements are in units stated in the original source. Conversions to metric or standard measurements are inserted in parenthesis following the given measure. Descriptions of landslides on the following pages contain dollar losses in year 2001 dollars as designated in original references.
Table 1.—Significant Nisqually earthquake-induced landslides. This table shows name of the landslide, location, preliminary dollar losses if obtained, and a short description. Tabular information is modified from a reconnaissance report by URS Corporation for FEMA Region X, Nisqually Earthquake Disaster Field Office (2001, unpub. data).
________________________________________________________________________
| Landslide | Landslide
location: Latitude/longitude (where known) City/County in Washington |
Preliminary dollar losses (where ob- tainable) – in year 2002 dollars |
Comments |
|---|---|---|---|
| Salmon Beach | 47017’52” N 122031’59” W Near Tacoma, Pierce County |
$1,505.428 | Steep, unstable slope; slump debris slide |
| Maple Valley/ Cedar River |
47028’16” N 122008’47” W Near Renton, King County |
$1,714,400 | Soil fall from near- vertical valley wall; debris flow from sand in fan, debris dam in river |
| East side of Capitol Lake (Marathon Park)/ Deschutes Park- way |
47001’24” N 122053’54” W Olympia, Thurston County |
$22,200,000 | Debris slide/flow into Capitol Lake |
| Maplewild Ave. | 47027’28” N 122022’03” W Burien, King County |
$7,600,000 | Houses perched along steep slope; slope dropped several inches; apparent Structural damage |
| Tolmie State Park | Thurston County | $ 384,000 | Structural damage from lateral spreading |
| Trosper Sunset Lake Mobile Home Park |
47000’29” N 122054’55” W Thurston County |
Losses not obtained | Lateral spreading; sand boils |
| U.S. Highway 101 Near Sate Road 8 |
47003’30” N 123000’49” W |
$919,570 | Fill failure/slump; debris flow |
| 36th Street, north of SW Admiral Way |
47034’56” N 122024’ W West Seattle, King County |
Losses not obtained | Movement beneath road towards houses; damage to pile structures beneath Houses |
| Alaskan Way Viaduct |
Seattle, King County | Estimate one: $500,500,000 Repairs to existing Viaduct structure, Plus cost of geo- technical study, which was $500,000 |
Damage due to presently un- determined causes; possible lateral spreading, shaking; liquefaction; most likely a combination of all |
| Estimate two: $1,000,500,000 Replacement of Viaduct plus cost of geotechnical study |
Repair vs. Replacement scenario is undecided as of this writing |
||
________________________________________________________________________
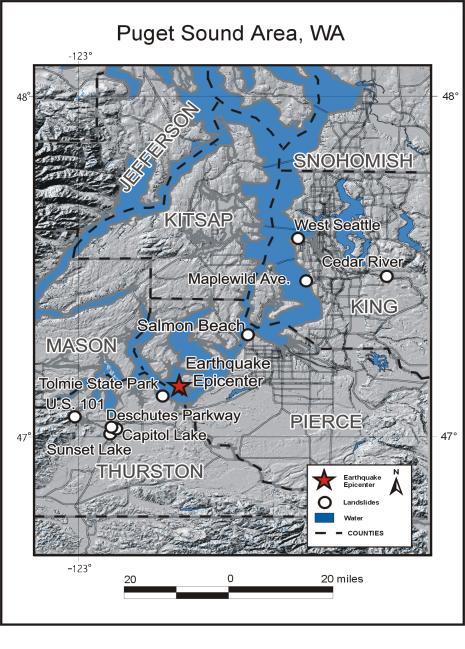
Figure 1.—Puget Sound area, Washington—map of locations of significant landslides described in Table 1. Several minor occurrences of slumping and liquefaction are not shown, because they did not cause serious damage or any documented losses--they are discussed briefly in the text. (FEMA Region X, Nisqually Earthquake Disaster Field Office, 2001, unpub. data).
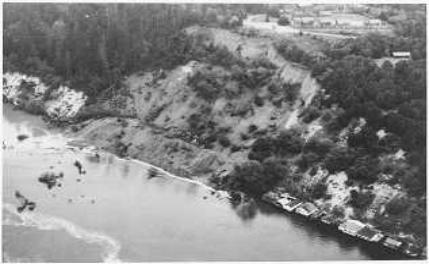
Salmon Beach landslide, near Tacoma
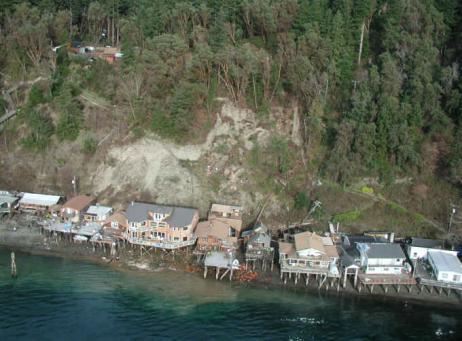
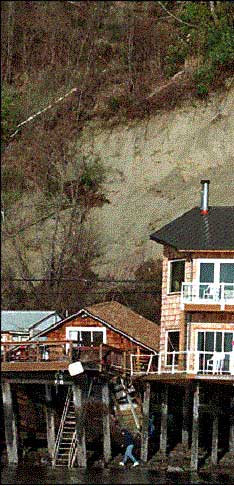
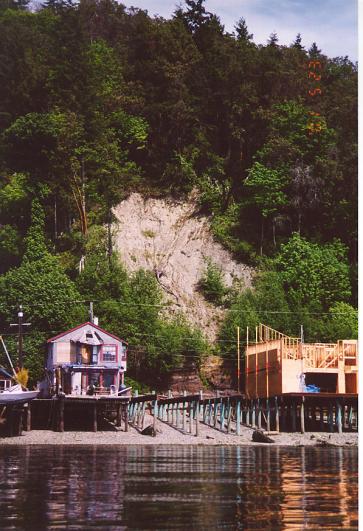
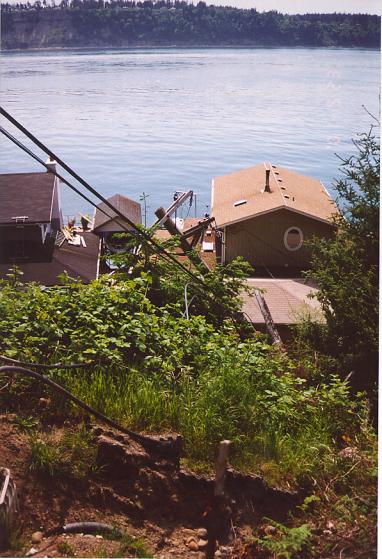
Salmon Beach, a community located north of the Tacoma Narrows bridge, near Point Defiance and Tacoma, Washington, was previously damaged by landslides that occurred as a result of the 1949 Puget Sound earthquake (Figure 2). Landslides occurred here again during the 2001 Nisqually earthquake and the Salmon Beach landslide is considered to be the landslide with the current highest hazard (Figure 3). This landslide was approximately 1,000 cubic meters (1,300 cubic yards) in volume, and demolished two houses (Figures 4 and 5) located at the base of the steep bluff along the shores of Puget Sound. A larger slide of about 10,000-20,000 cubic meters (13,000 to 26,000 cubic yards) of material remained poised on the slopes above the houses and threatened eight additional dwellings. This larger slide slid between 20 and 25 feet (6.6 and 8.3 meters) and has a scarp 20 to 25 feet (6.6 to 8.3 meters) high and approximately 20 feet (60 meters) in length along the top of the bluff. Eight houses were red-tagged as a result of inspection by Pierce County officials when notified of the existence of the larger landslide. Sewer, water, and electrical lines were also damaged by the landslide (Figures 6 and 7). Two homeowners associations that manage Salmon Beach and the city of Tacoma Public Utilities department (D. Koberstein, oral commun., 2001) have estimated total losses for the 2001 Salmon Beach landslide activity at $1,505,428.
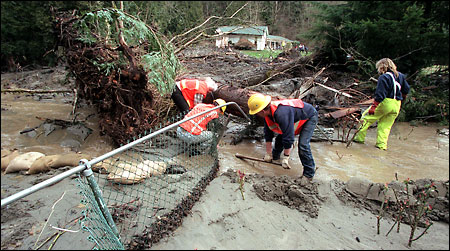
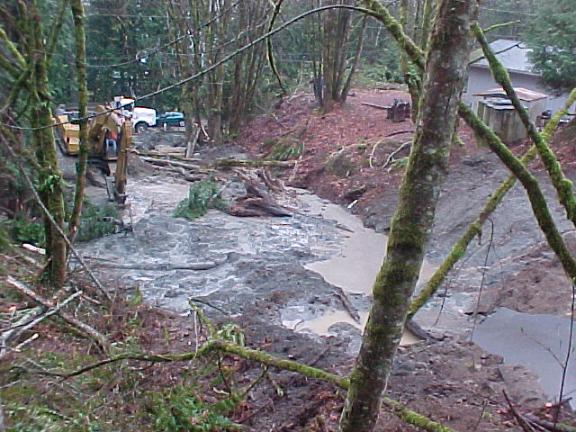
Cedar River landslides – City of Renton
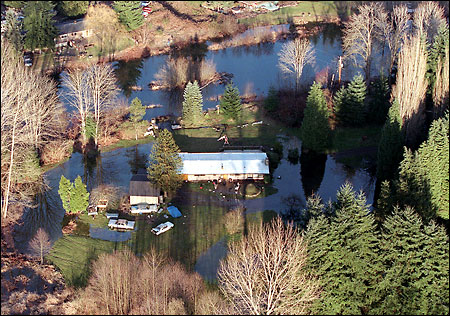
The earthquake triggered failure of glacial deposits, estimated at 50,000 cubic yards (38,000 cubic meters), along the right bank of the Cedar River at River Mile 5.0 near the city of Renton. The landslide completely demolished 200 meters (200 yards) of King County’s Punnett-Briggs Revetment, a public flood-erosion-control facility. This landslide blocked the Cedar River and created a reservoir until earth-moving equipment could be sent to the site and a ditch dug through the slide debris (Figures 8 and 9). Significant ponding and overbank flooding upstream of the blockage resulted in immediate flooding of two homes and several yards, together with significant portions of the City of Renton’s Ron Regis Park (Figure 10). Impounded water in Ron Regis Park re-entered the river through a previously constructed salmon spawning channel adjacent to the landslide dam causing considerable erosion (King County Department of Natural Resources, oral commun., 2002).
In South Renton, a second landslide just upstream from the landslide that dammed the Cedar River formed at the base of a steep bluff. This mudflow carried about 10,000 cubic yards (7,600 cubic meters) of soil, trees and debris down to the Cedar River. The mudflow slammed into a house about 70 meters (70 yards) down slope nearly breaking it in two and filling about half of the structure with debris. A woman who had just run out of the house during the earthquake narrowly avoided being buried by landslide debris that filled the kitchen where she had been standing (Figure 11). Damage estimates for these landslides have been estimated to be $1,714,400. (King County Department of Natural Resources, written commun., 2002).
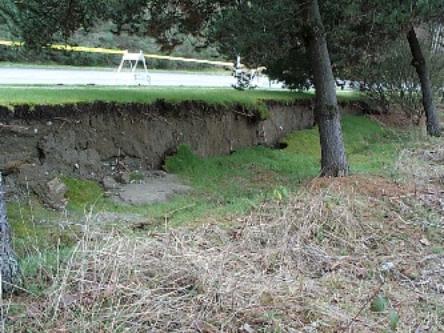
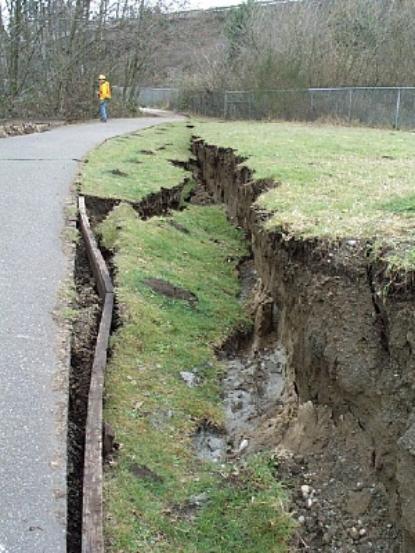
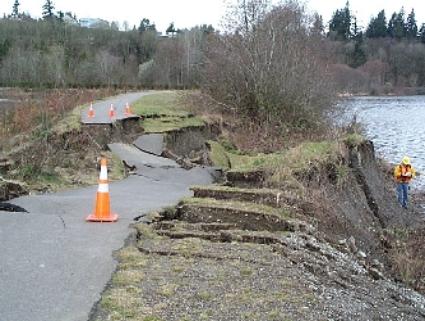
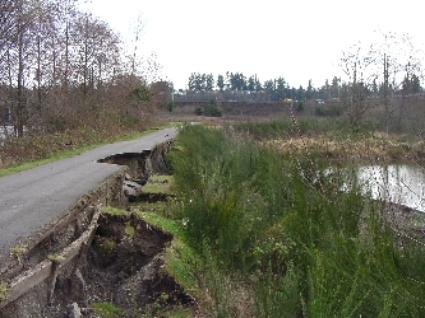
Capitol Lake/Deschutes Parkway landslides
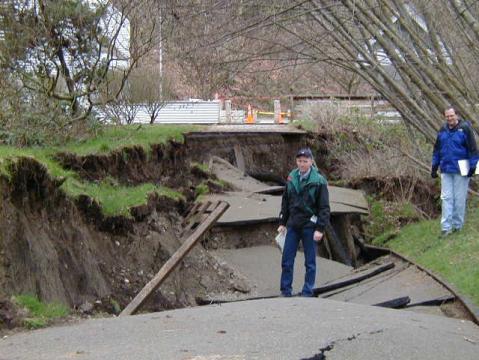
Deschutes Parkway is underlain by fill, and artesian springs emerge within the fill. The Parkway is constantly failing and causing problems. During the earthquake, loose sandy soil under the Parkway liquefied, then flowed down slope toward Capitol Lake, collapsing part of the thoroughfare, and temporarily closing the road. This area had experienced similar lateral spreading and ground failures in the 1949 and 1965 Puget Sound earthquakes (Chleborad and Schuster, 1998). There was no way to put in an auxiliary or temporary road immediately after the failure. At the south end of the parkway, another landslide occurred 6 weeks after the earthquake. This damage will take approximately 3 years to repair – 2 years to get permits and one year for construction, during which time the Parkway will be closed (T. Meade, Public Works Department, Olympia, Washington, oral commun. 2002).
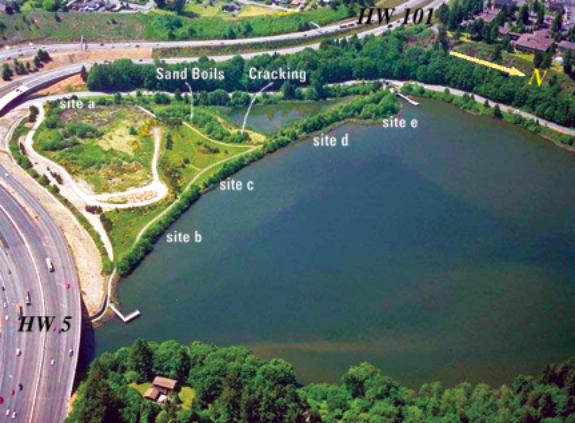
Several lateral spread landslides occurred around the margins of Capitol Lake. The dike on the southern margin of the lake failed in several places; some of the cracks that formed contained ejected silt, indicating that liquefaction occurred. Water and sewer lines crossing the area were broken in places. Deschutes Parkway on the west margin of the lake was closed in several places because of slumping along the edge of the lake. (U.S. Geological Survey, unpub. data, 2001, [http://geohazards.cr.usgs.gov/wa/]). Estimated landslide damage to Capitol Lake, Marathon Park, and Deschutes Parkway was approximately $22,200,000 (T. Meade, Public Works Department, City of Olympia, written commun., 2002). See Figures 12 – 18 for photos of landslide and lateral spreading damage to these areas.
Maplewild Avenue landslide, City of Burien
Damage to Maplewild Avenue area occurred between 29th Place SW and 33rd Avenue SW. Five houses perched along a steep slope sustained structural damage when underlying uncompacted fill formed a translational slide during the earthquake. The area underwent several inches of vertical displacement (FEMA, unpub. data, 2001). The Federal Highway Administration has determined that Maplewild Avenue, being a Federal Arterial, is eligible for $6.6 million in federal aid for repair and rebuilding. One house was demolished and sustained between $300,000 and $400,000 in losses. Two other houses suffered damages of $300,000 total (Anonymous, City of Burien Dept. of Public Works oral commun., 2002). Maplewild Avenue, built in the 1930’s, was extremely narrow and on a steep slope, and will be brought up to current Federal highway standards. City officials continue to work with homeowners who live in houses adjacent to the Maplewild Avenue right-of-way for repair to curb and driveways. Total losses sustained were approximately $7,600,000.
Tolmie State Park , Thurston CountyTolmie Park, which is located 8 miles northeast of Olympia, is a day-use marine park with 600 m of saltwater shoreline bordering on Puget Sound. This 106-acre park is located 5 kilometers (3.1 miles) from the Nisqually Earthquake epicenter, and is visited annually by an average of 156,000 visitors, mainly between Memorial Day and Labor Day. All Sewer and water lines in the area were severely damaged, causing the temporary shutdown of the entire park. Bridges, trails, and a kitchen shelter were damaged by lateral spreading (Seattle Post-Intelligencer, 2001). Park officials suspect liquefaction as a contributing factor to the damage. The Federal Emergency Management Agency (FEMA) still requires a geological survey of the ground to see if it has stopped shifting, in order for repairs to begin, and damage estimates are to be finalized. Preliminary damage estimate for ground failure at Tolmie State Park is approximately $384,000, if the shelter is replaced rather than repaired (Lynn Nordloh, Tolmie State Park Ranger, written commun., 2002).
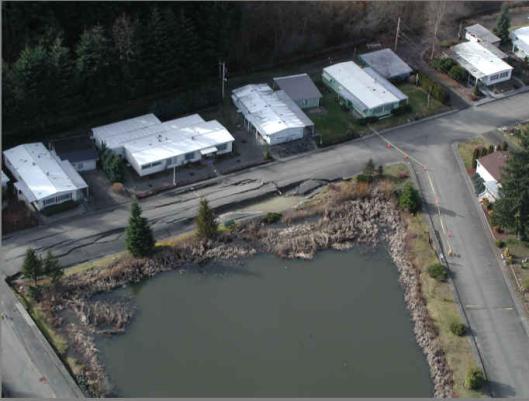
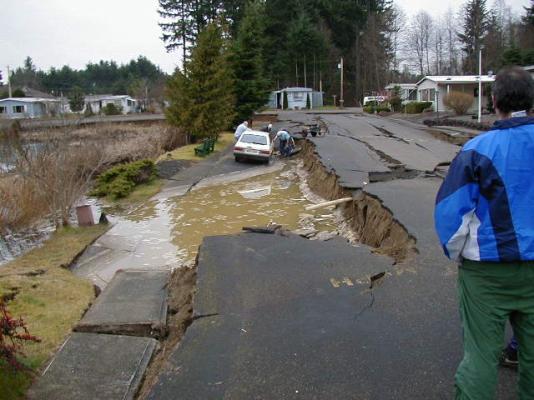
Sunset Lake – Trosper Memorial Trailer Park, near Tumwater
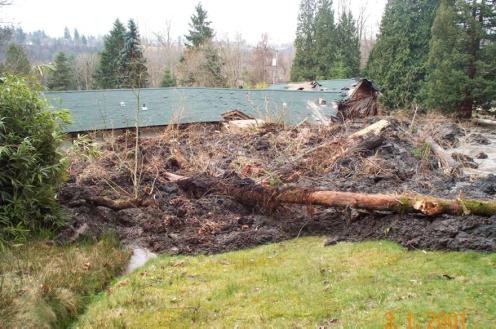
A lateral spread occurred around the perimeter road of Sunset Lake. This area also suffered other instances of lateral spreading, liquefaction, and sand boils, with damage to mobile homes (Bray and others, 2001) (Figures 19 and 20). Damage estimates were not available, at this writing, for this area.
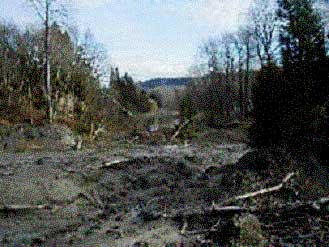
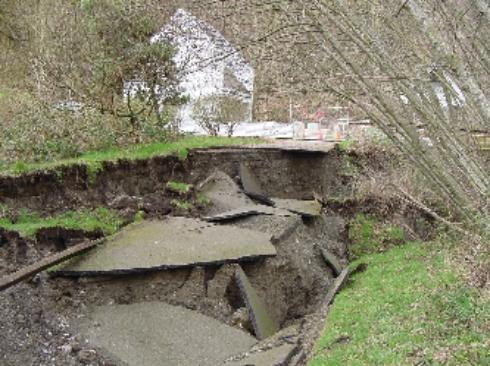
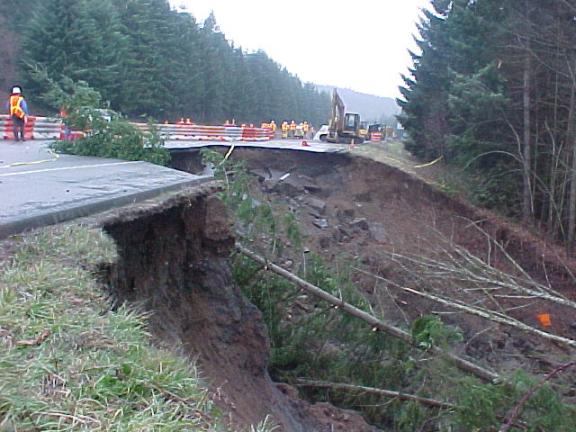
U.S. Highway 101, Thurston County
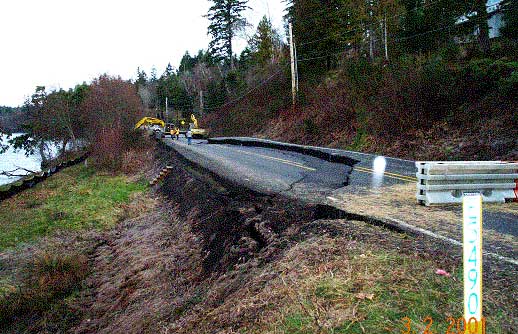
The northbound lanes of U.S. 101, near the junction with SR 8, west of Olympia slid away during the earthquake. A slump/debris flow about 15,000 cubic meters (20,000 cubic yards) in volume occurred in the artificial roadway fill of U.S. 101, removing one lane of the four-lane highway and flowing down slope between two houses before terminating on the surface of a street about 250 m down slope. Within 12 hours of the quake, Washington State Department of Transportation (WSDOT) maintenance workers constructed a detour roadway in the median area of the freeway and reopened the roadway to traffic in the northbound direction. Loss estimates are $919,570. Work to restore the highway to its original condition was completed in August 2001 (Washington State Department of Transportation, 2002) (Figures 21–23).
These landslides occurred on private property, with 10 homes affected, one property yellow-tagged by building officials. There were numerous cracks at the top of the slope
(Oregon Department of Geology and Mineral Industries, 2001). The cost of damage was unavailable.
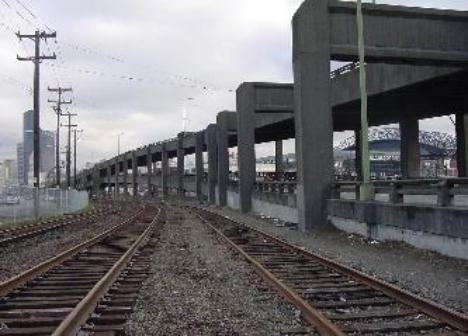
The Alaskan Way Viaduct, Seattle
The Alaskan Way Viaduct, is a 3.36 km-long double-deck, reinforced-concrete viaduct between Yesler Way and So. Washington Street in Seattle, Washington (Figure 24). It has supporting columns that currently are leaning up to 7.8 cm according to the Washington Department of Transportation. State inspectors discovered the eastward tilt during the first week after the earthquake. It appears that some tilt may have been present before the earthquake, and increased during the earthquake. There are several possible reasons for the leaning of the viaduct, according to Harvey Coffman, Bridge Engineer for Washington State Department of Transportation (WSDOT) ranging from lateral spreading, to liquefaction, and/or ground shifting. A $500,000 study to determine whether to replace the viaduct or bring it up to current seismic standards is currently underway, and is expected to take at least 18 months. Speculation on costs of replacing the viaduct with an underground, ground level or elevated freeway run from $500 million to $1 billion, or more, and would take 10 years to complete.
The viaduct, completed in its entirety in 1956, did not include special reinforcing for earthquake resistance. Studies conducted by WSDOT in 1995-96 indicated that the Viaduct alignment is underlain by loose fill soils with a high susceptibility to liquefaction. It was concluded that widespread liquefaction would occur along the Viaduct in response to a peak ground acceleration of 0.16g. The study also indicated that widespread liquefaction would also likely result in failure of the Alaskan Way Seawall (adjacent to the viaduct) and massive lateral spreading of the adjacent soil. After the Nisqually earthquake, liquefaction features were observed in the South of Downtown district and the Harbor Island area of Seattle; however, none of these surface manifestations was observed beneath the viaduct, and there was no indication of failure of the Alaskan Way Seawall following the earthquake (WSDOT, 2001). One of the areas that sustained ground failure at the Alaskan Way Viaduct, is shown in Figure 24.
The Washington Department of Transportation (2001) Report of the Structural Sufficiency Committee recommends replacing the viaduct, because retrofitting it would cost about as much as replacement, and the resulting retrofitted structure would not last as long as a replacement. Currently there are several options for replacement. WSDOT
and the City of Seattle are working together on the plans, since the adjacent seawall is owned by the City of Seattle and is a crucial structural element for replacement of the viaduct. Some of the replacement options are: replace in kind, replace with a tunnel, or replace with a boulevard.
As of April 2001, the Department of Transportation estimated that $62.71 million in general costs would be required to repair roads, bridges, and ferry terminal facilities damaged in the earthquake (Wash Department of Transportation, 2002).
Other Areas of Landslide Damage
(Note: Loss figures are in year 2001 dollars as cited in original references)
The following list is not exhaustive, but includes some of the smaller landslides for which no damage figures were obtained.
1. King County Airfield – Serious cracking in runways due to liquefaction and lateral spreading (Washington State Emergency Military Department, 2002).
2. Seattle Harbor Island (consisting of a ferry terminal, ports, and a marina)-Experienced liquefaction, lateral spreading, and settlement (Oregon Department of Geology and Mineral Industries, 2001)
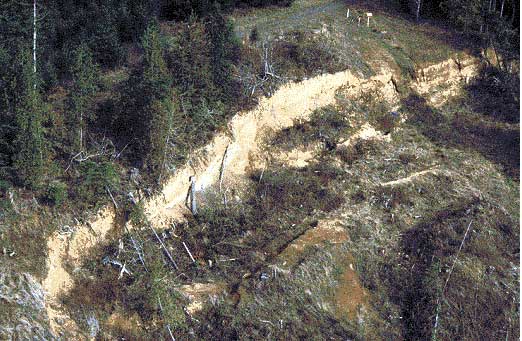
3. Chambers Creek Road, near Steilacoom, Pierce County- Ground failure was observed along the compacted earth embankments on both the upstream and downstream sides of a bridge on this road (Figure 25). A small landslide was observed adjacent to the western edge of the upstream abutment of the bridge a (Bray and others, 2001).
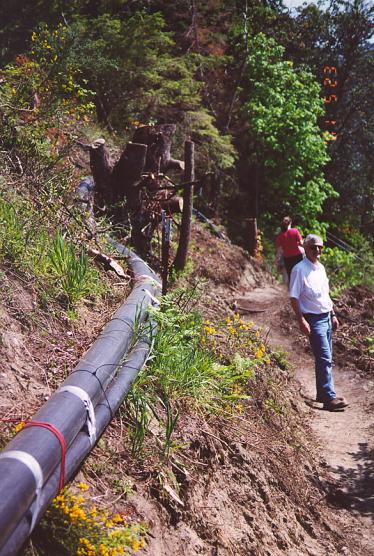
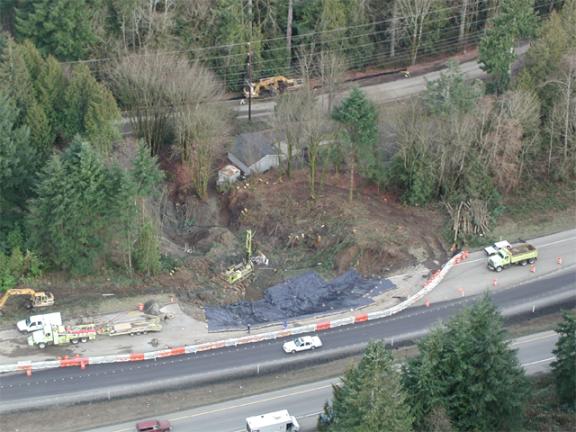
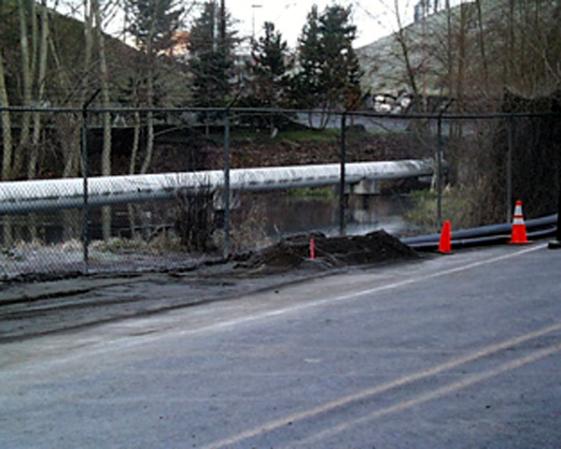
4. Pipeline Landslide- located at a pipeline right-of-way 2.4 km due east of Nulls Crossing (Lewis County), near Chahallis. The pipeline intersects a road at this point. It is possible that this slide was not triggered by the earthquake; however, the presence of newly fallen trees near the slide scarp may indicate that it was probably seismically induced (Bray and others, 2001) (Figure 26).
5. Burlington Northern/Santa Fe Railroad system reported losses of $200,000 for repair of tracks, that were distorted by shifting and buckling, and possible lateral spreading (Gus Melones, Burlington Northern/Santa Fe Railroad Public Affairs Office, Seattle, Washington, written commun., 2001).
Other Highway Damage
1. Both lanes of State Route (SR) 302 at the north end of Case Inlet near the town of Allyn dropped 18 inches (0.5 meters) to 24 inches (0.6 meters) for a quarter of a mile ( 0.4 kilometer) through a landslide area (Bray and others, 2001).
2. State Road (SR) 202 near Snoqualmie Falls cracked and the shoulder fell away (Bray and others, 2001).
3. Victor Fill area near the City of Port Orchard experienced a slump in artificial fill. The vertical displacements of the highway along the slide scarp were as much as 60 centimeters (24 inches). Damage estimates are $159,898, which includes temporary repairs, and restoration of the highway to service (Scott Woodruff, WSDOT, oral commun., 2001) (Figure 27).
4. A small slump buckled two lanes of Interstate 405 at 44th Street in Renton, raised the pavement and channeled water onto the freeway (Tom Baker, WSDOT, written commun., 2002,). The type of slide is unknown as of this writing.
Conclusions
Preliminary losses incurred by landslides induced by the Nisqually Earthquake totaled approximately $34.3 million (year 2002 dollars) if the Alaskan Way Viaduct in Seattle is excluded. If damages from the viaduct are included, the total losses increase from a low range figure of $500,500,000 (cost of geotechnical study and repairs to the existing Alaskan Way Viaduct) to a high of $1,000,500,000 (replacement of portions of the viaduct), depending on the scenario the Washington Department of Transportation adopts for repair or repair/replacement of the viaduct, as discussed in the text. Ground failure occurring at the site of the Alaskan Way Viaduct has resulted in substantial damage, and these viaduct losses total up to one third or more of losses due to all effects of the Nisqually earthquake, which as of 2002, were estimated at approximately $2 billion (excluding viaduct replacement).
Loss estimates do not include those that could not be obtained, including the Sunset Lake/Trosper Mobile Home Park landslide, the West Seattle landslide, and some of the smaller landslides. Future investigations and studies that revisit some of these sites, could possibly facilitate a more complete accounting of landslide losses. It cannot be emphasized enough that all of these figures will undoubtedly change as additional information is obtained, and final cost figures become available. See appendices A and B for additional information on the landslide loss and damage evaluations and loss figures for total losses and damages from all causes, for the Nisqually Earthquake.
Recommendations For Further Study
It is the nature of landslide loss-figures that final totals may take years to assess and compile. It is commonly necessary to obtain a preliminary accounting of losses within a few months, and then to revise loss estimates at the end of the first year. Many loss assessments depend on engineering reports and other evaluations that may take a great deal of time.
It is also recommended that, where possible, losses be tallied as to type of loss by reporting agencies. For instance, it would be beneficial for future engineering studies for agencies such as FEMA to differentiate economic losses as to those from earthquake shaking, and those from landsliding and other ground failures. This differentiation is important because, as in the case for the Alaskan Way Viaduct, determination of whether the structure was damaged from shaking, liquefaction, lateral spreading, or a combination of factors, will affect future design criteria for repairs and/or reconstruction.
Acknowledgements
The author would like to thank FEMA for
their sponsorship of this investigation and especially Phillip Carpenter
of the FEMA Region X Disaster Center, Olympia, Washington, for information
on locations of landslides. Thanks also go to Edwin Harp, U.S. Geological
Survey, for encouragement and support for this work. The author also expresses
appreciation to officials of the Tacoma Public Utilities Department for
providing loss information and and field assistance at the Salmon Beach
landslide site. Many city and county officials throughout the Puget Sound
area reported damage statistics; their cooperation and candor are acknowledged
and appreciated
References
Bray, Jonathan D., Sancio, R. B., Kammerer, A. M., Merry, S.,