FORSPAN Model Users Guide
|
|
|
2003
U. S. Department of the Interior
U.S. Geological Survey
U. S. Department of the Interior
Gale A. Norton, Secretary
U.S. Geological Survey
Charles G. Groat, Director
This report is available only online at:
http://pubs.usgs.gov/of/2003/ofr-03-354/
Any use of trade, product, or firm names is for
descriptive purposes only and does not imply
endorsement by the U.S. Government.
Published in the Central Region, Denver, Colorado
Manuscript approved for publication
Graphics by the author
Abstract |
| The USGS FORSPAN model is designed for the assessment of continuous accumulations of crude oil, natural gas, and natural gas liquids (collectively called petroleum). Continuous (also called “unconventional”) accumulations have large spatial dimensions and lack well defined down-dip petroleum/water contacts. Oil and natural gas therefore are not localized by buoyancy in water in these accumulations. Continuous accumulations include “tight gas reservoirs,” coalbed gas, oil and gas in shale, oil and gas in chalk, and shallow biogenic gas. |
The FORSPAN model treats a continuous accumulation as a collection of petroleum-containing cells for assessment purposes. Each cell is capable of producing oil or gas, but the cells may vary significantly from one another in their production (and thus economic) characteristics. The potential additions to reserves from continuous petroleum resources are calculated by statistically combining probability distributions of the estimated number of untested cells having the potential for additions to reserves with the estimated volume of oil and natural gas that each of the untested cells may potentially produce (total recovery). One such statistical method for combination of number of cells with total recovery, used by the USGS, is called ACCESS. |
Introduction |
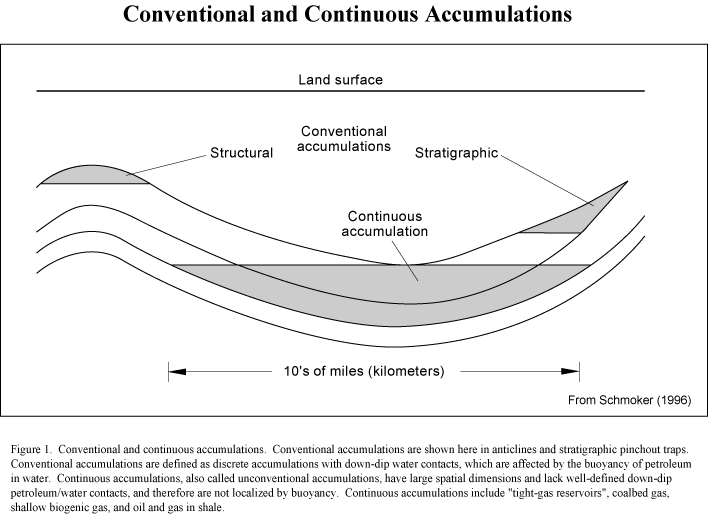
| An accumulation is one or more reservoirs of petroleum (a collective term for crude oil, natural gas, and natural gas liquids) that share a particular trap, charge, and set of reservoir characteristics. For purposes of assessment, an accumulation is treated as a single entity. The USGS identifies two major types of petroleum accumulations based on geology - conventional and continuous (Fig. 1). A conventional accumulation may be an entire field, or only those reservoirs of the field associated with a particular total petroleum system. A continuous accumulation is more extensive and may include several productive areas that (in non-USGS terminology) may be referred to as fields. Conventional accumulations are associated with structural or stratigraphic traps, commonly bounded by a down-dip water contact, and therefore affected by the buoyancy of petroleum in water (Schmoker, 1996; Schmoker, 1999). Continuous accumulations are areally extensive reservoirs of petroleum not necessarily related to conventional structural or stratigraphic traps. These accumulations lack well defined down-dip petroleum/water contacts, and thus are not localized by the buoyancy of oil or natural gas in water (Schmoker, 1996; Schmoker, 1999). Examples of continuous accumulations include “tight gas reservoirs,” coalbed gas, oil and gas in shale, oil and gas in chalk, basin-centered gas, and shallow biogenic gas. |
| To estimate the potential additions to reserves of continuous accumulations, the USGS has developed a model called “FORSPAN” (acronym for FORecast SPAN; Schmoker, 1999). The FORSPAN model treats a continuous accumulation as a collection of petroleum-containing cells for assessment purposes. A cell is a subdivision or area within a continuous accumulation having dimensions related to the drainage areas of wells. Cells are areas that could potentially be drained by one well, although some cells may have had more than one well drilled in them in the past. Thus a cell may contain more than one well. Each cell is capable of producing oil or gas, but the cells may vary significantly from one another in their production (and thus economic) characteristics (Schmoker, 1999). The potential additions to reserves from continuous petroleum resources are calculated by statistically combining probability distributions of the estimated number of untested cells having the potential for additions to reserves with the estimated volume of oil and natural gas that each of the untested cells may potentially produce (total recovery). One such statistical method for combination of number of cells with total recovery, used by the USGS, is called ACCESS (acronym for Analytic Cell-based Continuous Energy Spreadsheet System) and is described by Crovelli (2000). |
| Traditionally, continuous accumulations had been assessed by a volumetric approach.
Basic geologic characteristics (such as area, thickness, and porosity of reservoirs)
were treated as probabilistic variables to calculate in-place volumes of resource.
These variables all had associated uncertainties and were correlated with one
another in ways that were poorly understood and very difficult to model. According to Schmoker (2003), the FORSPAN model is based on the production performance of reservoirs, as empirically shown by wells. In this method, estimates of in-place oil or gas volumes are not developed. Instead, production data are used for forecasts of potential additions to reserves. Such reservoir-performance assessment models are particularly well suited to continuous accumulations that are already partially developed. The wells themselves serve as comprehensive analog computers that evaluate and weight all relevant reservoir parameters (such as thickness, water saturation, permeability, and porosity). In effect, production data are used to empirically provide the product of petroleum-in-place and recovery factor. Lacking sufficient drilling and production data, the assessor must draw upon information from analog accumulations. |
| This paper describes the implementation of the FORSPAN assessment model by presenting a realistic example. The example provides guidelines for completing the FORSPAN model input-data form (appendix 1) (Schmoker, 1999). The assessment of each continuous accumulation requires knowledge of a set of factors, including geologic conditions and exploration and production history. The example is generic and does not address all possibilities, but it does, however, address the more important factors required for completing the input-data form. |
| At various locations in the text, a set of questions that might help the assessor
consider the type of input needed and its geologic or exploration provenance.
Moreover, these questions, or ones like them, are frequently discussed in the
assessment meetings. |
Background | |||||||||||||||||||||
| In order to organize, evaluate, and delineate areas to assess, a hierarchical scheme of geographic and geologic units was developed (Klett and others, 1997). This scheme consists of regions, geologic provinces, total petroleum systems, and assessment units. Regions serve as organizational units and geologic provinces are used as prioritization tools. Total petroleum systems are geologic entities that include the rocks related by the generation from a pod or related pods of source rock and the subsequent migration and trapping of the resultant fluids. Undiscovered petroleum resources are assessed within subsets of the total petroleum systems called assessment units. | |||||||||||||||||||||
| A geologic province is an area having characteristic dimensions of hundreds of kilometers that encompasses a natural geologic entity (for example, a sedimentary basin, thrust belt, or accreted terrane) or some combination of contiguous geologic entities. Each geologic province is a spatial entity with common geologic attributes. Province boundaries are drawn as much as possible along natural geologic boundaries, although in some places they may be located at boundaries that have technologic or political significance (for example, along specific water-depth contours in the open oceans). Total petroleum systems and assessment units are delineated for each geologic province that is assessed. Boundaries of total petroleum systems and assessment units do not have to be entirely contained within a geologic province. | |||||||||||||||||||||
| The total petroleum system is a mappable entity encompassing genetically related petroleum that occurs in seeps, shows, and accumulations (discovered or undiscovered) that have been generated by a pod or by closely related pods of mature source rock, together with the essential mappable geologic elements (source, reservoir, seal, and overburden rocks) that controlled fundamental processes of generation, migration, entrapment, and preservation of petroleum. Particular emphasis is placed on the genetic similarities of petroleum fluids within total petroleum systems. | |||||||||||||||||||||
| An assessment unit is a mappable part of a total petroleum system in which
discovered and undiscovered oil and gas accumulations constitute a single relatively
homogeneous population for which the methodology of resource assessment is
applicable. A total petroleum system might equate to a single assessment unit.
If necessary, a total petroleum system may be subdivided into two or more assessment
units such that each assessment unit is sufficiently homogeneous in terms of
geology, exploration considerations, and risk to assess individually. A numeric code identifies each region, province, total petroleum system, and assessment unit. The criteria for assigning codes are uniform throughout the project and throughout all publications of the project. An example of the numeric codes used in this study is: | |||||||||||||||||||||
| |||||||||||||||||||||
| Assessment-unit codes ending with 01 to 59 indicate conventional accumulations; those ending with 61 to 79 indicate continuous oil or gas accumulations; those ending with 81 to 99 indicate continuous coalbed gas accumulations. No assessment-unit codes end with 00. |
Terms and Definitions |
| Selected terms of particular importance to the USGS assessment of undiscovered resources in total petroleum systems are defined here. The definitions are intended to be generally explanatory rather than strictly technical. |
| Accumulation: One or more reservoirs of petroleum that share a particular trap, charge, and set of reservoir characteristics. For purposes of assessment, an accumulation is treated as a single entity. An accumulation may encompass several fields or equate to a single field or reservoir; alternatively a field may equate to a one or several accumulations. The USGS identifies two major types of petroleum accumulations based on geology - conventional and continuous. A conventional accumulation may be an entire field, or only those reservoirs of the field associated with a particular total petroleum system. A continuous accumulation is more extensive and may include several productive areas that (in non-USGS terminology) may be referred to as fields. |
| Assessment Unit: A mappable part of a total petroleum system in which discovered and undiscovered oil and gas accumulations constitute a single relatively homogeneous population for which the methodology of resource assessment is applicable. An assessment unit might equate to a total petroleum system, but total petroleum systems may be subdivided into two or more assessment units such that each assessment unit is sufficiently homogeneous in terms of geology, exploration considerations, accessibility, and risk to be assessed individually. An assessment unit may be identified as conventional if it contains conventional accumulations or as continuous if it contains a continuous accumulation. |
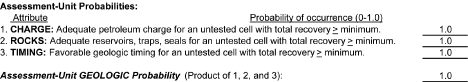
| Assessment Unit Probability: The assessment unit probability, expressed as
a decimal fraction, represents the likelihood that, in an assessment unit,
at least one untested cell of at least a defined minimum total recoverable
volume exists that has the potential for its volume to be added to proved reserves
in a given time frame. The assessment unit probability is the product of the
probabilities of three geologic attributes (charge, rocks, and timing). Barrels of Oil Equivalent (BOE): A unit of petroleum volume in which the gas portion is expressed in terms of its energy equivalent in barrels of oil. For this assessment, 6,000 cubic feet of gas equals 1 barrel of oil equivalent (BOE). |
| Cell: A subdivision or area within a continuous accumulation having dimensions related to the drainage areas of wells (not to be confused with finite-element cells as used in reservoir modeling). Cells are areas that could potentially be drained by one well, although some cells may have had more than one well drilled in them in the past. Thus a cell may contain more than one well. For cells, the potential recoverable oil and natural gas volumes are called total recoverable volumes. For wells, these volumes are called estimated ultimate recovery (EUR). Two types of cells are recognized: tested cells, those evaluated by drilling, and untested cells. Tested cells are categorized as productive, having at least one well with reported production, and nonproductive, evaluated with drilling but where none of the wells have reported production. Untested cells have not been evaluated by wells. |
| Composite Total Petroleum System: A mappable entity encompassing all or a portion of two or more total petroleum systems. A composite total petroleum system may be defined when accumulations within an assessment unit are charged by more than one source rock. Composite total petroleum systems may also be defined in cases where field productions cannot be disaggregated into production for reservoirs charged by separate source rocks. |
| Continuous Accumulation: An accumulation consisting of areally extensive reservoirs of petroleum not necessarily related to conventional structural or stratigraphic traps. These accumulations lack well-defined down-dip petroleum/water contacts, and thus are not localized by the buoyancy of oil or natural gas in water. |
| Conventional Accumulation: An accumulation associated with structural or stratigraphic traps, commonly bounded by a down-dip water contact, and therefore affected by the buoyancy of petroleum in water. |
| Cumulative Petroleum Production: Reported volume of petroleum that has been produced up to some given date. Cumulative oil, cumulative gas, and cumulative production are sometimes used as similar terms. |
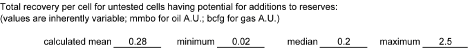
| Estimated Ultimate Recovery (EUR): The total expected recoverable volume of oil, gas, and natural gas liquids produced from a well under economic and engineering conditions likely to exist within the forecast span. For cells, the equivalent term is total recovery. |
| Field: An area consisting of a single reservoir or multiple reservoirs of petroleum, all grouped on, or related to, a single geological structural and (or) stratigraphic feature. Individual reservoirs in a single field may be separated vertically by impervious strata or laterally by local geologic barriers (American Petroleum Institute, 1995). When projected to the surface, the reservoir(s) within the field form a contiguous area that can be circumscribed. |
| Forecast Span: A specified future time span in which petroleum accumulations have the potential to provide additions to reserves. The forecast span affects (1) the minimum undiscovered conventional accumulation size or minimum total recovery per cell, (2) the number of years in the future that reserve growth is estimated, (3) economic assessments, and (4) the accumulations that are chosen to be considered in this assessment. |
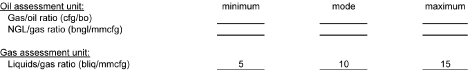
| Gas to Oil Ratio (GOR): Ratio of gas to oil (in cubic feet/barrel) in an accumulation. In USGS assessments, GOR is calculated using known gas and oil volumes at surface conditions. |
| Liquids to Gas Ratio (LGR): Ratio of total petroleum liquids (including oil, condensate, and natural gas liquids) to gas (in barrels/million cubic feet) in a gas accumulation. The LGR is calculated using known petroleum liquids and gas volumes at surface conditions. This ratio is used to assess the liquid co-products associated with undiscovered gas in gas accumulations. |
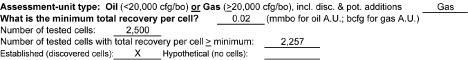
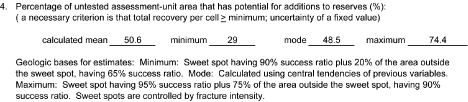
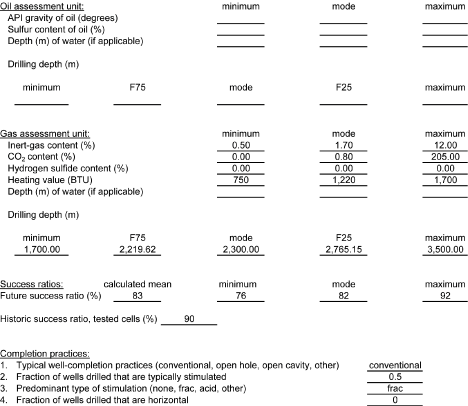
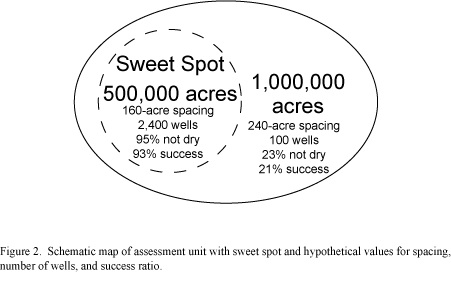
| Minimum Total Recovery per Cell: The smallest total recovery per cell (volume
of oil or gas) considered in the assessment process for continuous-type accumulations. Sweet Spot: An area within a continuous accumulation where production characteristics are relatively more favorable. |
| Total Petroleum System: A mappable entity encompassing genetically related petroleum that occurs in seeps, shows, and accumulations (discovered or undiscovered) that have been generated by a pod or by closely related pods of mature source rock, together with the essential mappable geologic elements (source, reservoir, seal, and overburden rocks) that controlled fundamental processes of generation, migration, entrapment, and preservation of petroleum. |
| Total Recovery: The total expected recoverable volumes of oil, gas, and natural gas liquids that could be produced from a cell under economic and engineering conditions likely to exist within the forecast span. For wells, the equivalent term is estimated ultimate recovery (EUR). |
| USGS Assessed Petroleum Volumes: The quantities of oil, gas, and natural gas liquids that have the potential to be added to reserves within some future time frame. The USGS assessed petroleum volumes include those from undiscovered conventional accumulations or development of continuous accumulations, whose sizes are greater than or equal to the stated minimum accumulation size or total recovery per cell, and from the reserve growth of fields already discovered. |
Identification and Delineation of Continuous Assessment Units |
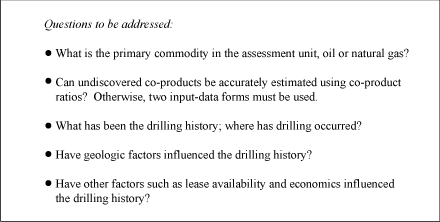
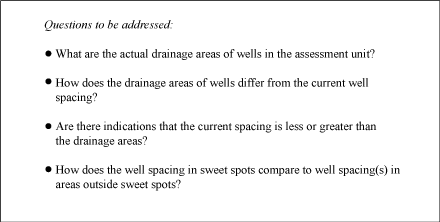
| Proper identification and delineation of a continuous assessment unit that is homogeneous in terms of geology and exploration/discovery history is essential to the FORSPAN assessment model. The following questions can be used to help the assessor identify and delineate continuous assessments. |
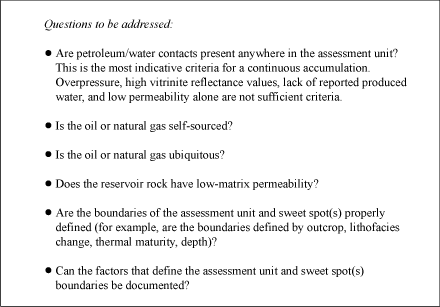
|
| Continuous accumulations generally do not have sharp oil-water or gas-water contacts. They may, however, have vertically or laterally extensive, gradational contacts that would classify these types of accumulations somewhere in a transition zone between strictly continuous and strictly conventional accumulations. Continuous accumulations are commonly self-sourced, have ubiquitous petroleum, and commonly have low matrix permeability. Overpressure, high vitrinite reflectance values, or low matrix permeability alone are not sufficient criteria for the identification of a continuous accumulation. Similarly, the lack of reported produced water is insufficient evidence for the existence of a continuous accumulation. Coalbed gas accumulations, for example, often produce large volumes of water. |
| In most areas, sweet spots cannot be delineated and mapped. Their existence and areas can only be estimated. |
Supporting Data Required for FORSPAN |
| Essential geologic, geographic, and engineering data are required prior to using the FORSPAN model. Once collected and compiled, these data are used in conjunction with a set of equations (numbered throughout the form) to provide estimates of the number and total recovery of cells with undiscovered petroleum potential within the assessment unit, which in turn, are used to calculate the potential additions to reserves. The data and equations required for the completion of the FORSPAN model basic input data form are given in the spreadsheet in appendix 2. |
| Two databases from IHS Energy Group (2002a, b), the PI/Dwights Plus US Well Data and PI/Dwights Plus US Production Data, are used extensively in the ongoing U.S. Geological Survey National Oil and Gas Assessment. Additional field and reservoir data come from NRG Associates (2002). |
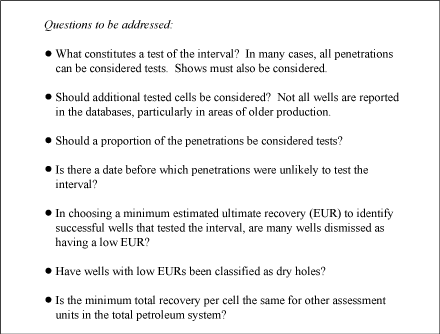
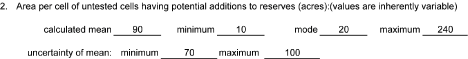
| FORSPAN requires the estimated ultimate recovery (EUR) of oil or natural gas from wells or analog wells to aid in the estimation of total recovery per cell. A cell is a subdivision or area within an assessment unit having dimensions related to the drainage areas of wells (Schmoker, 1999). Because cumulative production is the most common volume reported for wells, EUR’s must be estimated from these volumes by modeling. For the NOGA study, cumulative production data is obtained from the IHS Energy Group’s PI/Dwights Plus US Well Production database. |
| The basic historical information on which the assessment is made is well-level information. In some cases, wells have been drilled at spacing close enough to interfere with one another. If well-level EUR values and spacings were extrapolated into undrilled areas, there is the possibility that the resource would be underestimated (because undrained areas remained between wells) or overestimated (because interfering wells double-counted the same resource). |
| Because of the potential problems with pure well information, the concept of cells was developed. Cells have dimensions that relate to the actual drainage areas of wells. Thus the total recoveries from cells combined with the number of cells in an assessment unit should yield an estimate of volume of resource that is self-consistent. |
| The actual drainage areas of wells vary within an assessment unit. The difference in drainage area probably is the most important cause of the difference in EUR, which often ranges two orders of magnitude in an assessment unit. Thus drilling practice that uses a set well spacing may leave some resource undeveloped in areas between wells at the same time as some pairs of well interfere with one another. |
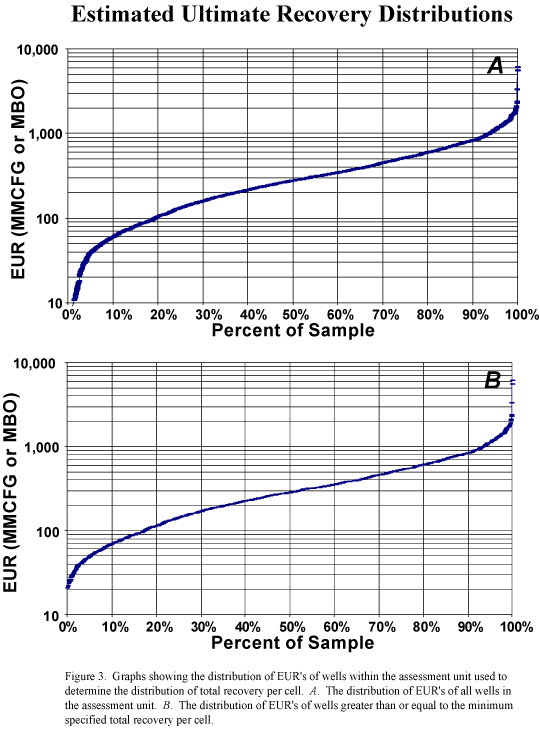
| Once calculated, the overall distribution of EUR’s that tested the assessment-unit interval, as well as the distributions by discovery-history segments, are derived. These distributions serve as a guide for estimating total recovery per cell and the selection of a minimum recovery, below which cells are considered unsuccessful. |
Input-Data Form | ||||||||||||||||||||||||||||||||||||||||||||||||||||||||||||||||||||||||||||||||||||||||||||||||||||||||||||||||||||||||||||||||||||||||||||||||||||||||||||||||||||||||||||||||||||||||||||||||||||||
| This section corresponds to the completed data-input form shown in appendix 3. The form consists of seven sections, which are: | ||||||||||||||||||||||||||||||||||||||||||||||||||||||||||||||||||||||||||||||||||||||||||||||||||||||||||||||||||||||||||||||||||||||||||||||||||||||||||||||||||||||||||||||||||||||||||||||||||||||
| ||||||||||||||||||||||||||||||||||||||||||||||||||||||||||||||||||||||||||||||||||||||||||||||||||||||||||||||||||||||||||||||||||||||||||||||||||||||||||||||||||||||||||||||||||||||||||||||||||||||
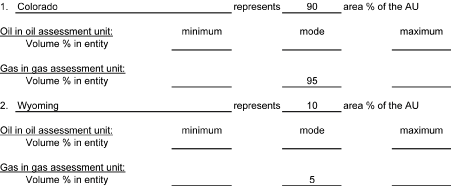
Identification information supplies the data necessary for record keeping and assessment organization. Statistical combination of the minimum total recovery per cell and geologic probabilities (from Characteristics of Assessment Unit), number of untested cells, total recovery per cell, and co-product ratios yields probability distributions for quantities of petroleum having the potential to be added to reserves. Selected ancillary data provide a set of information (not used directly in assessment calculations) that is required for economic and environmental analyses. Allocation percentages allow the apportionment of assessed potential additions to reserves to various land entities of interest within the assessment unit. | ||||||||||||||||||||||||||||||||||||||||||||||||||||||||||||||||||||||||||||||||||||||||||||||||||||||||||||||||||||||||||||||||||||||||||||||||||||||||||||||||||||||||||||||||||||||||||||||||||||||
|
Conclusions |
| The USGS FORSPAN assessment model for continuous petroleum accumulations requires geology- and engineering-based input data. Necessary input data are recorded on the form described in this report, which is completed for each assessment unit of a continuous accumulation. The form consists of seven sections: |
|
| Identification information supplies the data necessary for record keeping and assessment organization. Statistical combination of the minimum total recovery per cell, geologic probabilities (from Characteristics of Assessment Unit), number of untested cells, total recovery per cell, and co-product ratios yields probability distributions for quantities of petroleum having the potential to be added to reserves. Selected ancillary data provide a set of information (not used directly in assessment calculations) that is required for economic and environmental analyses. Allocation percentages allow the apportionment of assessed potential additions to reserves to various land entities of interest within the assessment unit. |
References Cited |
| American Petroleum Institute, 1995, Standard definitions for petroleum statistics: Washington, D.C., American Petroleum Institute, 62 p. Bailey, R.G., 1995, Description of the ecoregions of the United States: USDA Forest Service Miscellaneous Publication No. 1391 (Rev.), Second Edition, 108 p. Crovelli, R.A., 2000, Analytic resource assessment method for continuous (unconventional) oil and gas accumulations - the “ACCESS” method: U.S. Geological Survey Open-File Report 00-044, 34 p. IHS Energy Group, 2002a [includes data current as of December, 2001], PI/Dwights Plus US Production Data: Englewood, Colo., IHS Energy Group; database available from IHS Energy Group, 15 Inverness Way East, D205, Englewood, CO 80112, U.S.A. IHS Energy Group, 2002b [includes data current as of December, 2001], PI/Dwights Plus US Well Data: Englewood, Colo., IHS Energy Group; database available from IHS Energy Group, 15 Inverness Way East, D205, Englewood, CO 80112, U.S.A. Klett, T.R., Ahlbrandt, T.S., Schmoker, J.W., and Dolton, G.L., 1997, Ranking of the world’s oil and gas provinces by known petroleum volumes: U.S. Geological Survey Open-File Report 97-463, 1 CD-ROM. NRG Associates, 2002 [includes data current as of December, 2000], The Significant Oil and Gas Fields of the United States: Colorado Springs, Colo., NRG Associates, Inc.; database available from NRG Associates, Inc., P.O. Box 1655, Colorado Springs, CO 80901, U.S.A. Schmoker, J.W., 1996, Method for assessing continuous-type (unconventional) hydrocarbon accumulations, in Gautier, D.L., Dolton, G.L., Takahashi, K.I., and Varnes, K.L., eds., 1995 National assessment of United States oil and gas resources--Results, methodology, and supporting data: U.S. Geological Survey Digital Data Series DDS-30, Release 2 (1 CD-ROM). Schmoker, J.W., 1999, U.S. Geological Survey assessment model for continuous (unconventional) oil and gas accumulations - the “FORSPAN” model: U.S. Geological Survey Bulletin 2168, 9 p. Schmoker, J.W., 2003, U.S. Geological Survey assessment
concepts for continuous petroleum accumulations, in
USGS Uinta-Piceance
Assessment Team, compilers,
Petroleum systems and geological assessment of oil
and gas in the Uinta-Piceance
Province, Utah and Colorado: U.S. Geological Survey
Digital Data Series DDS-69-B, Version 1 (1 CD-ROM) |
Appendix 1 |
Appendix 2 |
Appendix 3 |
Appendix 4 |
Distribution Types |
Triangular Distributions |
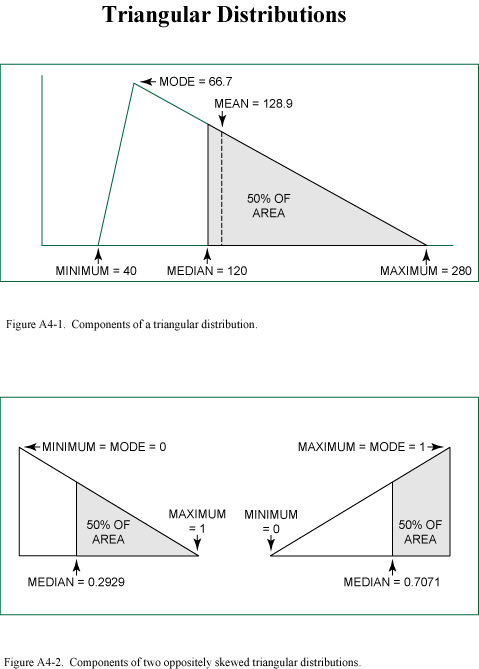
| Triangular distributions are used in the FORSPAN model to show the uncertainty about the geologic values on the input form. The triangular distribution is commonly used in probabilistic studies. It has the advantages of being simple to visualize and being easy to describe with only three parameters, minimum, maximum, and a central value (fig. A4-1). |
| There are three central values that should be distinguished: the mode, median, and mean. The mode is the value for the peak of the distribution; it is the “most likely” value. The median is the value for which there is a 50 percent chance of smaller than that value and a 50 percent chance of larger than that value. The mean is the average value over the entire distribution. For a symmetrical triangular distribution, these three central values are all identical. For an asymmetrical triangular distribution, these three central values are all different. |
| Given the minimum, the maximum, and any one of the central values, the other
central values can be calculated. The relation between the values entered
on the input-data form (minimum, mode, and maximum) and mean is given by (minimum + mode + maximum) / 3 = mean |
| Triangular distributions can only accommodate limited skewness. If the mode of the distribution is placed at either the minimum or maximum value, the median will be 0.2929 times the maximum minus the minimum towards the other extreme. Thus the median is constrained to lie within roughly the central 40 percent of the value range (fig. A4-2). |
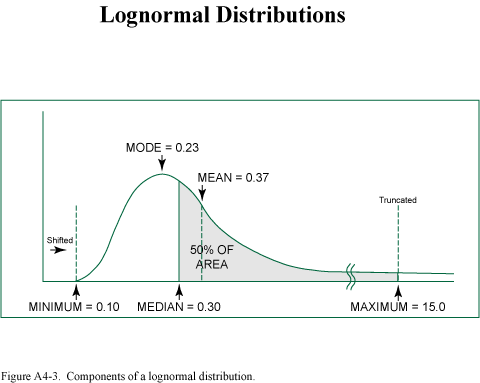
Lognormal Distributions |
| Lognormal distributions are used in FORSPAN to model the distribution of EUR values. EUR’s, like conventional field sizes, have a very skewed distribution with a few very high values and many low values. Triangular distributions cannot represent these high values of skewness. The distributions are again described using three values: a minimum, a maximum, and a central value (mode, median, or mean) (fig. A4-3). |
| Regular lognormal distributions have a minimum value of 0 and no maximum value. For a more realistic distribution, the truncated shifted lognormal is used. The distribution is shifted to the right so that the distribution minimum is at the required value rather than 0. The truncation takes place on the right-hand tail to eliminate the possibility of unreasonably high EUR’s. The 0.1 percent fractile is the truncation point. This very small percent keeps the recalculated fractiles close to the original input. |
Figures |
| Figure 1. Conventional and continuous accumulations. Conventional accumulations are defined as discrete accumulations with down dip water contacts, which are affected by the buoyancy of petroleum in water. Continuous accumulations (unconventional accumulations) have large spatial dimensions and lack well defined down-dip petroleum/water contacts, and therefore are not localized by buoyancy. Continuous accumulations include tight gas, basin-center gas, coalbed gas, shallow biogenic gas, and oil and gas in shale.
|
| Figure 2. Map of example assessment unit with known sweet spot.
|
| Figure 3. Graphs showing the
distribution of EUR’s of wells within the assessment unit used to
determine the median total recovery per cell.
|
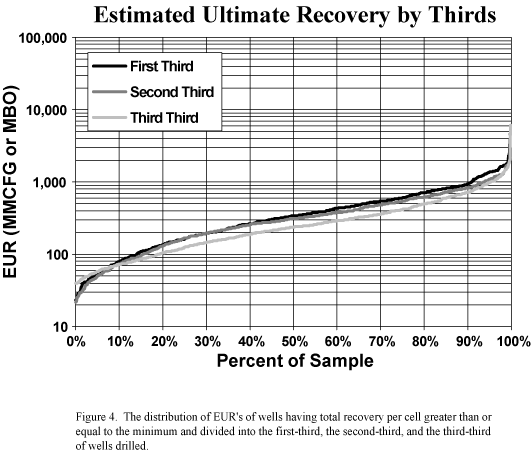
| Figure 4. Graph showing the distribution of EUR’s of wells having total recovery per cell greater than or equal to the minimum and divided into the first-third, the second-third, and the third-third of wells drilled.
|
| Figure A4-1. Components of a
triangular distribution.
|
| Figure A4-3. Components of a lognormal distribution.
|
| AccessibilityFOIAPrivacyPolicies and Notices | |
| |
|