
By Alan F. Chleborad
U.S. Geological Survey Open-File Report 03-463
U.S. Department of the Interior
U.S. Geological Survey
Precipitation-induced landslides are a significant, recurring problem in the Seattle area. Major landslide events have been costly. Heavy precipitation at the end of December 1996 and in January and March of 1997 produced hundreds of landslides that resulted in loss of life and millions of dollars of damage (Baum and others, 1998; Coe and others, 2000; Laprade and others, 2000). Damage to City of Seattle facilities alone exceeded $34 million (Pageler, 1998).
Results of a comprehensive
study of historical landslides in Seattle (using data that dates back to
1897,
Laprade and others, 2000), show that a high
percentage
of reported landslides occurred in the November through April time frame
(Figure 1). Precipitation in the form of rain,
and occasionally snow, plays a major
role in the occurrence of landslides. Cyclonic storms that 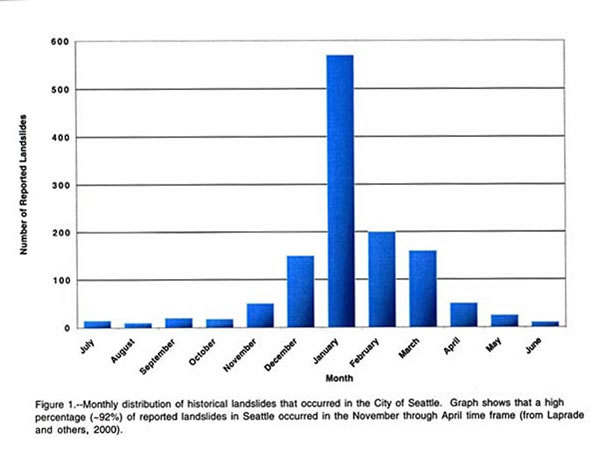 develop
over the Pacific
Ocean and move inland account for much of the wet-season precipitation. Average
November through April precipitation in the Seattle area is approximately
28.0 in. (711 mm), or 73% of the mean annual precipitation of 38.2 in. (970
mm).1
develop
over the Pacific
Ocean and move inland account for much of the wet-season precipitation. Average
November through April precipitation in the Seattle area is approximately
28.0 in. (711 mm), or 73% of the mean annual precipitation of 38.2 in. (970
mm).1
In 1999, in response
to the landslide hazard in the Seattle area, a U.S. Geological Survey project
was undertaken
to identify precipitation thresholds
that might
be used to anticipate or forecast the occurrence of landslides. Because
the historical record indicates that a high percentage of landslides occur
during
the wet season,
the study focused on the compilation and analysis of historical, wet-season
landslide and climatic data. The effort resulted in the identification
of an empirically
derived 3-day and prior 15-day cumulative precipitation threshold for
the occurrence of landslides in Seattle (Chleborad, 2000). The 3-day/15-day
threshold (Figure
2a) is the basis of a prototype system for forecasting landslides
in the Seattle area (http://landslides.usgs.gov/html_files/ofr-00-0469/seattlenet.html). 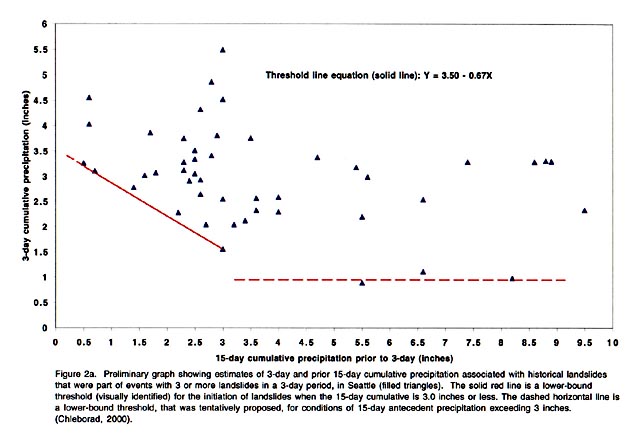
The threshold (Figures 2a and 2b) is based on an analysis of historical precipitation data associated with wet-season landslides that occurred during the period 1933-1997, in Seattle. In the initial part of the study, hourly rainfall data recorded at seventeen City of Seattle rain gauge sites, and daily climatic data (rainfall, snowfall and air temperature) from twelve National Weather Service sites in the Seattle area, were compiled and analyzed. Antecedent precipitation amounts were estimated using data from stations closest to the individual landslide locations. Information on location and time of occurrence was obtained in a search of City of Seattle landslide files, newspaper reports, geotechnical reports, USGS landslide project files, and personal field notes. The search yielded location and time of occurrence information on 187 historical landslides. Most of the landslides in the database of 187 landsides are shallow slumps, slides, or debris flows (estimated failure depths less than or equal to 10 ft (3.3 m); however, the database also includes deep-seated landslides.
For the analysis, a level of activity of three or more landslides in a 3-day (72 hr) period was selected. It was assumed that, at that level of activity, precipitation played a major role in the development or triggering of the landslides. Further, identification of a threshold for events that produce a specified level of activity is desirable for emergency response planning and preparedness. Inspection of the database revealed that 91 of the 187 slides could be shown to be part of landslide events with 3 or more landslides in a 3-day period. The approximate lower-bound precipitation threshold, defined by the equation P3 = 0.67P15 + 3.50, was visually identified after constructing a scatter plot showing 3-day precipitation amounts (P3) that occurred immediately prior to the landslides and antecedent 15-day cumulative precipitation (P15) that occurred prior to the 3-day totals (Figure 2a). The precipitation threshold thus defined is interpreted as an approximate lower-bound threshold below which the specified level of precipitation-induced landslide activity does not occur or occurs only rarely and above which it may occur under certain conditions.
 Additional
data on 108 historical landslides that occurred in Seattle between 1950 and
1990 (Tubbs, 1974; Laprade
and others, 2000), that were found to be
part of 3-day events with three or more landslides, but were not part of the
original 91 landslides used to define the threshold, were subsequently compiled
and analyzed (Chleborad, unpub. data, 2002). As shown in Figure
2b, the additional
data are consistent with the previously defined threshold; approximately 90%
of the added data points (filled circles) fall on or above the threshold. In
addition, the newly plotted data better define the threshold for conditions
of 15-day cumulative precipitation greater than 3.0 inches.
Additional
data on 108 historical landslides that occurred in Seattle between 1950 and
1990 (Tubbs, 1974; Laprade
and others, 2000), that were found to be
part of 3-day events with three or more landslides, but were not part of the
original 91 landslides used to define the threshold, were subsequently compiled
and analyzed (Chleborad, unpub. data, 2002). As shown in Figure
2b, the additional
data are consistent with the previously defined threshold; approximately 90%
of the added data points (filled circles) fall on or above the threshold. In
addition, the newly plotted data better define the threshold for conditions
of 15-day cumulative precipitation greater than 3.0 inches.
In the analyses that follow, estimates
of 3-day and prior 15-day cumulative precipitation and 6-hour peak rainfall
intensity are based on data from City
of Seattle rain
gauges, National Weather Service (NWS) stations, or SchoolNet Automated Weather
System (AWS) sites nearest the respective landslide locations (Figure
3).
In some cases, where hourly rainfall data was not available from the nearest
station
or two stations were equidistant from the landslide or nearly so, data from
an additional station in the vicinity was included in the compilation. Because
average
hourly rainfall intensity over a 6-hour period (I6) has been identified as
a useful variable for developing a rainfall threshold for "shallow" landslide
initiation in Seattle (Godt, report in review), I6 was selected to examine relationships
between rainfall intensity, 3-day and prior 15-day antecedent precipitation,
and landslide occurrence.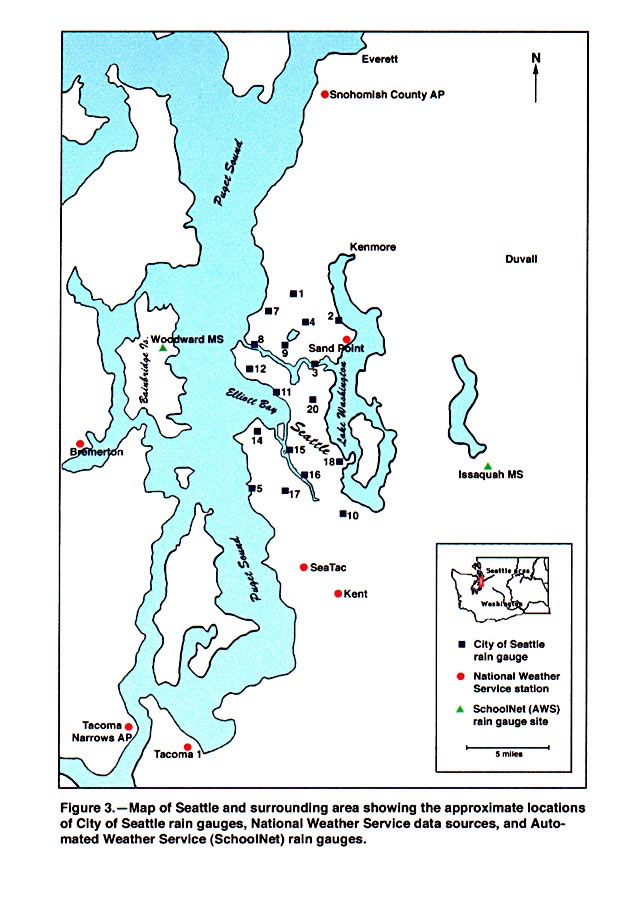
In this report, the term landslide includes various types of slope failures on both engineered and natural slopes. Typically, the landslides exhibited one or more of the following types of movement involving earth or debris: translational slides, flows, rotational slumps, and topples or falls (see Cruden and Varnes, 1996). It should be noted that studies of landslide occurrence in the Seattle area often reveal a contributing human influence (such as placement of fill materials, improper drainage, leaking or broken water pipes, blocked culverts, excavation, etc.). In their comprehensive study of historical landslides, Laprade and others, 2000, state that "Some factor of human influence was reported for 84 percent of the landslides citywide in Seattle". However, the contribution of the human influence factors relative to other factors was not determined.
The purpose of this report is to present the results of the three-wet-season (2000 - 2001, 2001 - 2001, and 2002 - 2003) evaluation of the threshold, to present a newly developed rainfall history graph that allows a visual examination of relationships between rainfall intensity, 3-day and prior 15-day cumulative precipitation, and the precipitation threshold, and to briefly discuss the development of a prototype web-based landslide forecasting system for the Seattle area.
1 Period of record 1931 - 2002 (NWS SeaTac AP)
The quality and completeness of information on landslides and associated precipitation, compiled for this report, is variable. Original source documents and reports were carefully examined in an effort to obtain the most accurate data on landslide timing and locations. Nearly all of the landslide locations were field checked and photographs of the sites were taken. However, the landslides were not studied in detail and only minimal descriptive information was obtained. The search yielded few eyewitness accounts. Times of occurrence are inferred based on available information from various sources. Sources include the City of Seattle database of landslides (unpub. data, 2001 - 2003), City of Seattle landslide specialists, geotechnical consultants, newspaper reports, and local residents.
Ideally, measurements of precipitation are made with recording devices located at the landslide sites. Because such measurements are rare or do not exist, data from City of Seattle rain gauge, NWS stations, and AWS stations located closest to the respective landslide locations were used for the analysis. In nearly all cases, the selected stations are located within a few miles of the respective landslides, and thus it is assumed that the data are sufficiently representative of conditions at the respective landslide locations.
The 2000 - 2001 wet season in the
Seattle area was unusually dry. Cumulative precipitation for the six-month
period (November through April) at SeaTac Airport
(SeaTac AP) (fig. 4) totaled only 16.44 in. (417 mm) or
59% of the long-term average of 28.01 in. (711 mm). General conditions in the
Seattle
 area relative
to the 3-day and prior 15-day precipitation threshold are characterized in
Figure 5 using precipitation data from the National Weather
Service station at SeaTac
Airport. The threshold index (fig. 5) indicates conditions
of antecedent precipitation relative to the threshold (positive values indicate
conditions above the threshold).
The index is based on the threshold equation (P3 = 3.5 – 0.67P15)
and is defined as:
area relative
to the 3-day and prior 15-day precipitation threshold are characterized in
Figure 5 using precipitation data from the National Weather
Service station at SeaTac
Airport. The threshold index (fig. 5) indicates conditions
of antecedent precipitation relative to the threshold (positive values indicate
conditions above the threshold).
The index is based on the threshold equation (P3 = 3.5 – 0.67P15)
and is defined as:
P0 = P3 + 0.67P15 - 3.5 where, P0 is the threshold index, P3 is the 3-day (72 hr) cumulative precipitation, and P15 is the 15-day cumulative prior to the 3-day |
As shown in Figure
5, conditions
did not approach the threshold during the 2000 – 2001
wet season. At the SeaTac AP location the 3-day/prior 15-day conditions
were highest,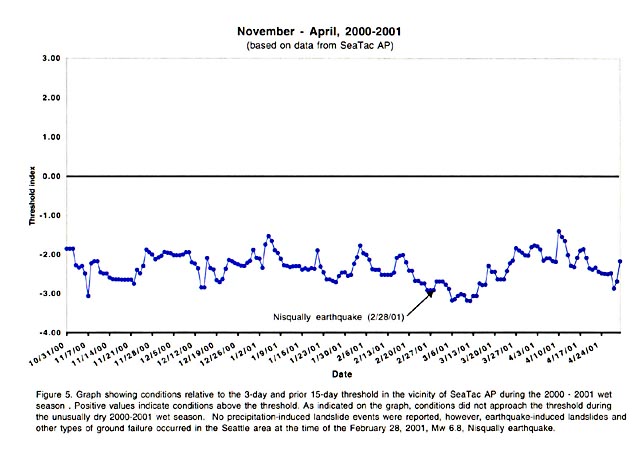 relative to the threshold, on April 10 when an index value
of -1.40
was reached (fig. 5). A maximum 3-day (72 hour) cumulative of 1.31 in. (33.2
mm) occurred on November 26 when the 15-day total prior to the 3-day was only
0.48 inches.
relative to the threshold, on April 10 when an index value
of -1.40
was reached (fig. 5). A maximum 3-day (72 hour) cumulative of 1.31 in. (33.2
mm) occurred on November 26 when the 15-day total prior to the 3-day was only
0.48 inches.
No precipitation-induced landslide events were reported for the 2000 - 2001 wet season. However, earthquake-induced landslides occurred in the Seattle area at the time of the February 28, 2001, Mw 6.8 Nisqually earthquake. Three-day and prior 15-day cumulative precipitation totals on February 28, 2001, the day of the Nisqually earthquake, were particularly low (fig. 5). These data provide an empirical basis for the conclusion that the dryer-than-usual soil was probably less vulnerable to landslides that the earthquake might otherwise have triggered.
Departures of total and monthly
precipitation from the norm during November - April of 2001 – 2002 are characterized in Figure
6 using data from the
NWS station at SeaTac. Total cumulative precipitation at SeaTac AP during
the period was 32.41 in (823 mm) or 15.7% above normal. As indicated in Figure
6,
most of the above normal monthly precipitation occurred in the month of
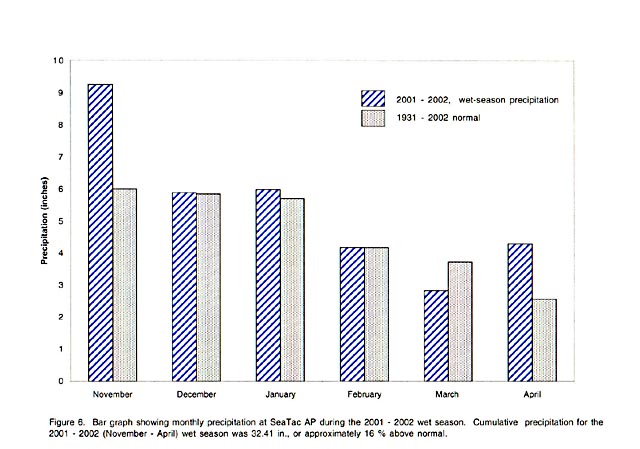 November.
A series of frontal systems brought heavy rainfall to the Seattle area
during the period November 13 to November 23 and again during the period
December 13-16.
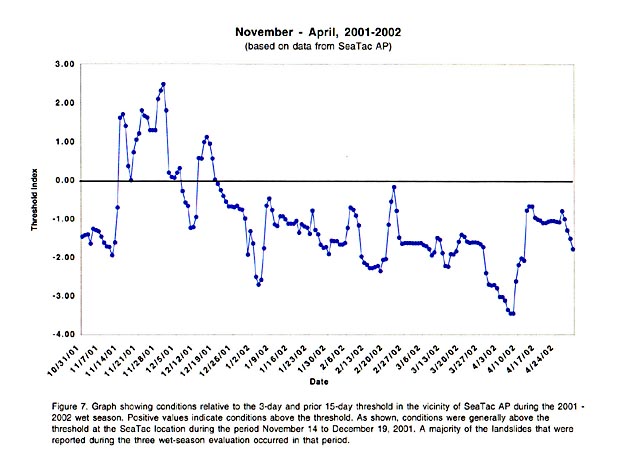
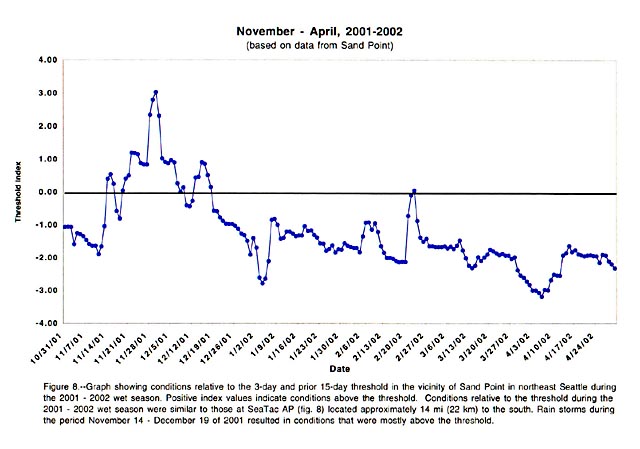
General conditions relative to the 3-day and prior 15-day precipitation
threshold during the 2001 - 2002 wet season are characterized using precipitation
data
from SeaTac AP and Sand Point (figs. 7 and 8).
As shown in Figures
7 and 8, conditions
were generally above the threshold between November 14 and December 19
of 2001. During the remainder of the wet season, at the SeaTac AP and Sand
Point locations,
conditions most closely approached the threshold on January 8 and February
23 of 2002 (figs. 7 and 8).
November.
A series of frontal systems brought heavy rainfall to the Seattle area
during the period November 13 to November 23 and again during the period
December 13-16.
General conditions relative to the 3-day and prior 15-day precipitation
threshold during the 2001 - 2002 wet season are characterized using precipitation
data
from SeaTac AP and Sand Point (figs. 7 and 8).
As shown in Figures
7 and 8, conditions
were generally above the threshold between November 14 and December 19
of 2001. During the remainder of the wet season, at the SeaTac AP and Sand
Point locations,
conditions most closely approached the threshold on January 8 and February
23 of 2002 (figs. 7 and 8).
 A
database of 59 reported landslides was compiled for the 2001-2002 wet season
analysis. Landslide locations and
descriptive information are presented in
Table 1. The database
includes reported landslides that occurred
on natural and engineered slopes in Seattle and neighboring areas. Landslides
in the database that are part of events with 3 or more landslides in a
3 day
period, in Seattle, are differentiated in a later section of the report.
A high percentage of the reported landslides are small, shallow slides
or debris
flows
with estimated depths of less than 10 ft (~3 m). Five deep-seated failures
with estimated depths greater than 10 ft (~3 m) were also reported. As
used here,
the term ‘human influence’ refers to factors such as blocked
culverts, improper drainage, leaking or broken water pipes, placement of
fill materials, or excavation that may have significantly affected slope
stability and landslide timing. The presence of a human influence was noted
for 9 of the slope failures (Table 1).
To facilitate the analysis, landslide occurrences with a reported or identified
human influence are also differentiated on Figures
9a and 9b (open
triangles). The 2001 – 2002 slope failures resulted in numerous road
closures, disrupted rail service between Seattle and Everett, Washington,
and damaged homes, cars, yards, and retaining walls and rockeries in residential
areas (Table 1).
A
database of 59 reported landslides was compiled for the 2001-2002 wet season
analysis. Landslide locations and
descriptive information are presented in
Table 1. The database
includes reported landslides that occurred
on natural and engineered slopes in Seattle and neighboring areas. Landslides
in the database that are part of events with 3 or more landslides in a
3 day
period, in Seattle, are differentiated in a later section of the report.
A high percentage of the reported landslides are small, shallow slides
or debris
flows
with estimated depths of less than 10 ft (~3 m). Five deep-seated failures
with estimated depths greater than 10 ft (~3 m) were also reported. As
used here,
the term ‘human influence’ refers to factors such as blocked
culverts, improper drainage, leaking or broken water pipes, placement of
fill materials, or excavation that may have significantly affected slope
stability and landslide timing. The presence of a human influence was noted
for 9 of the slope failures (Table 1).
To facilitate the analysis, landslide occurrences with a reported or identified
human influence are also differentiated on Figures
9a and 9b (open
triangles). The 2001 – 2002 slope failures resulted in numerous road
closures, disrupted rail service between Seattle and Everett, Washington,
and damaged homes, cars, yards, and retaining walls and rockeries in residential
areas (Table 1).
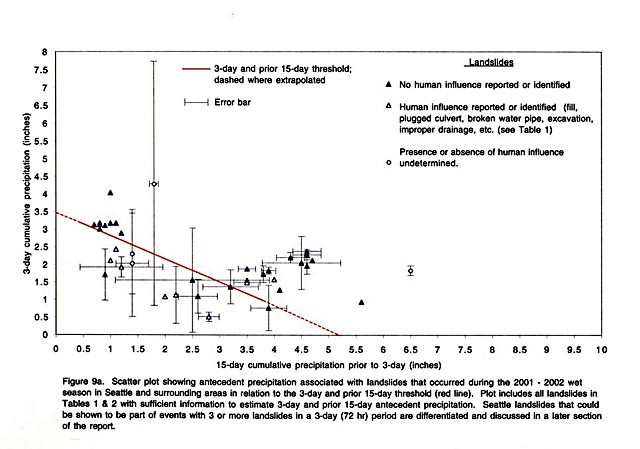
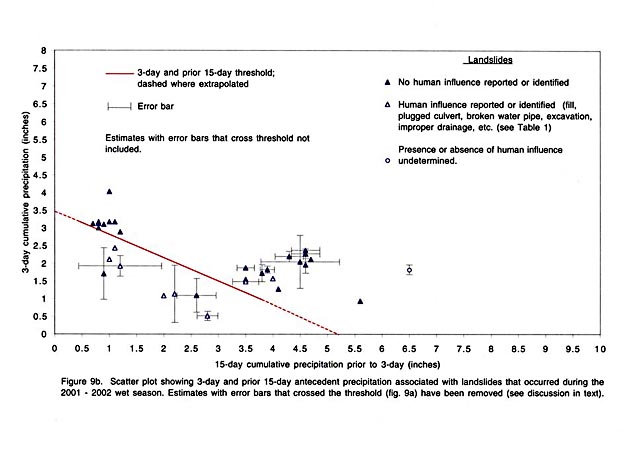
Information sufficient to estimate 3-day and prior 15-day antecedent precipitation totals was compiled for 45 of the 59 slope failures (Table 2). Estimates of antecedent precipitation for the 45 landslides are plotted on Figure 9a. In cases where a range of values is given (Table 2), the average of the end members of the ranges are plotted as ‘best estimates’ of the 3-day and prior 15-day totals.
Error bars shown on Figure 9a depict the range of possible values associated with some of the estimates. The error bars are the result of limited precipitation data (e.g., hourly data missing or unavailable) and (or) uncertainty in exact time of landslide occurrence (e.g. day of occurrence may have been reported but not the exact hour). As indicated on Figure 9a, error bars for 11 of the plotted points cross the threshold (landslide no.s 7, 8,16, 39, 43, 47, 48, 49, 50, 51, and 52, Table 2) indicating the actual location of those points could lie either above or below the threshold. Consequently, those estimates are not definitive and their usefulness in evaluating the threshold is limited. Therefore, they are not included in the analysis that follows. Note that some of the points plotted on the graph represent more than one landslide. Figure 9b shows the plotted points that remain after estimates with error bars that cross the threshold are removed.
 |
 |
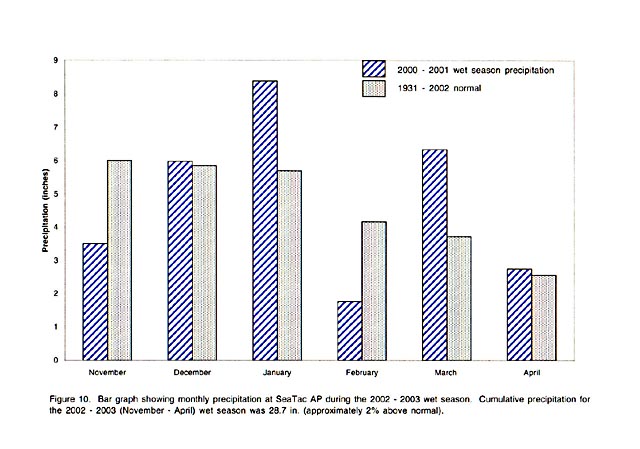
Total cumulative precipitation
in the Seattle area during the 2002 - 2003 wet season was near normal. At
SeaTac AP the November - April cumulative was 28.72
in.; monthly totals were highest in January and March of 2003 (fig.
10).
There were no major storms or landslide events during the 2002 – 2003 wet season.
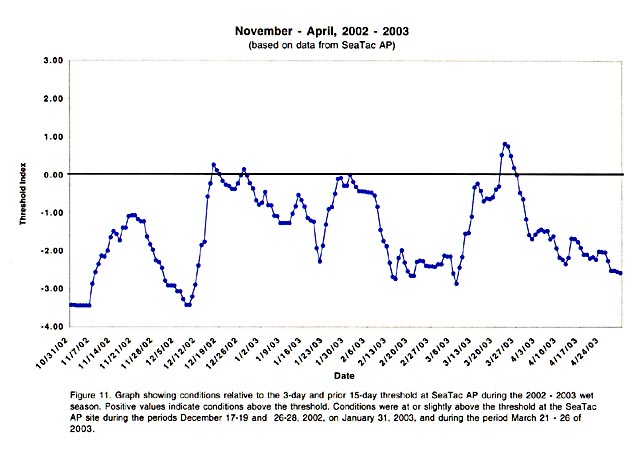
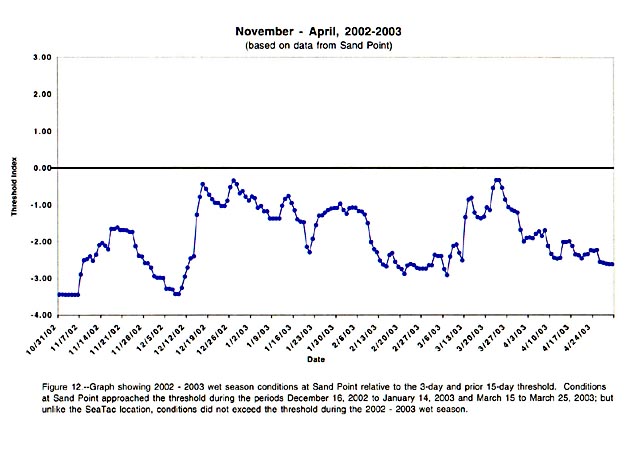
General conditions in the Seattle area relative to the 3-day and prior 15-day
 precipitation threshold are characterized by precipitation data from the SeaTac
AP and Sand Point stations (figs. 11 and 12). At the SeaTac site conditions
were at or slightly above the threshold briefly during the periods December
17- 19, and 26-28, 2002, on January 31, 2003, and later in the wet season,
during the period March 21-26 (fig. 11). At the Sand Point location conditions
did not cross the threshold during the wet season. Similar to the SeaTac site,
storms elevated the 3-day and prior 15-day totals to
their highest levels during the months of December, 2002 and January and
March of 2003 (fig.
12).
precipitation threshold are characterized by precipitation data from the SeaTac
AP and Sand Point stations (figs. 11 and 12). At the SeaTac site conditions
were at or slightly above the threshold briefly during the periods December
17- 19, and 26-28, 2002, on January 31, 2003, and later in the wet season,
during the period March 21-26 (fig. 11). At the Sand Point location conditions
did not cross the threshold during the wet season. Similar to the SeaTac site,
storms elevated the 3-day and prior 15-day totals to
their highest levels during the months of December, 2002 and January and
March of 2003 (fig.
12).
Information on seven reported landslides was compiled for the 2002-2003 wet season analysis (Table 3). The landslides occurred in Seattle (3), the Rolling Bay area on Bainbridge Island west of Seattle, and the Issaquah, Bremerton, and Kenmore, Washington areas (1 each). Six of the occurrences were shallow slides and(or) debris flows. One of the sites (landslide no. 2 in Table 3) was not visited and slide characteristics were not determined. A human influence was reported or identified for three of the slides (no's 1, 4, and 7). The presence or absence of a human influence is undetermined for the remaining four slides (no's 2, 3, 5, and 6 in Table 3). Reports of disruption and (or) damage caused by the landslides include destruction of a vacated home in the Rolling Bay area of Bainbridge Island, disruption of Amtrak Service due to debris on the track north of Careek Park in Seattle, contamination of Salmon-bearing Issaquah Creek, and a brief highway closure near Kenmore, Washington (Table 3).
 |
 |
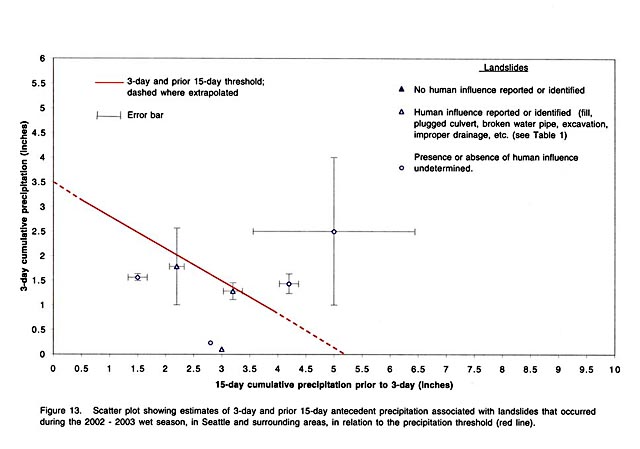
Antecedent precipitation
totals associated with the 2002 - 2003 landslides are tabulated in Table
4. Estimates of 3-day and prior
15-day precipitation based on rain gauges nearest the landslide sites
are plotted
on Figure 13. As indicated on Figure
13,
two of the slope failures (no.'s
4 and 7 in Table 4) have error bars that
cross the threshold. Estimates for two of the five remaining landslides plot
above the threshold and three below. A possible human influence is reported
or identified for three of the slope failures (no.s 1, 4, and 7, Table
4).
A total of 66 landslides were reported for the 2001 - 2002 and 2002 - 2003 wet seasons (Tables 1 and 3). The compilation yielded data sufficient for estimating 3-day and prior 15-day antecedent precipitation for 51 of the 66 slope failures. Because 13 of the 51 plotted points have error bars that cross the threshold, they are excluded, leaving a total of 38 for the analysis. Twenty-eight of the 38 remaining landslides are classified as shallow and four as deep-seated. There was insufficient information on depth of failure to classify six of the 38 slides as shallow or deep-seated. Ten of the 38 landslides have a reported or identified human influence. Basic statistics for estimates of antecedent precipitation associated with the 38 landslides are presented in Table 5.
|
Number of landslides |
3-day
(72 hr) cumulative precipitation |
15-day
cumulative precipitation |
Number above threshold |
Number below threshold |
|||
|---|---|---|---|---|---|---|---|
|
Range |
Mean |
Range |
Mean |
||||
|
Shallow landslide |
28 |
0.07-4.03 |
2.08 |
0.71-5.75 |
2.64 |
20 |
8 |
|
Deep-seated landslide |
4 |
0.51-1.82 |
1.25 |
2.63-4.04 |
3.34 |
2 |
2 |
|
Landslide (depth not estimated) |
6 |
1.08-3.17 |
2.13 |
0.91-6.50 |
2.93 |
4 |
2 |
|
Landslides with a reported or identified human influence |
10 |
0.07-2.43 |
1.38 |
1.02-4.04 |
2.43 |
3 |
7 |
Inspection of Table 5 reveals the following: Precipitation estimates for 26 of the 38 landslides (68%) fall above the threshold. Seven of the 12 landslides that fall below the threshold (Table 5 and Figures 9b and 13) have an identified human influence, suggesting that, for the purpose of threshold identification, landslides with a significant human influence should be considered separately from landslides that occur under natural conditions. For example, human influence factors such as improper drainage, plugged culverts, and broken water lines may result in local concentrations of groundwater that raise soil pore pressures to critical levels despite relatively low amounts of antecedent 3-day and prior 15-day cumulative precipitation that occur below the threshold. Shallow landslides occurred under a wide range of 15-day cumulative totals, whereas the four deep-seated landslides occurred when 15-day prior estimates were relatively high (Table 5). Similar results were obtained with the previous analysis of 198 historical Seattle landslides (Chleborad, 2000) which showed a high percentage of deep-seated landslides associated with 15-day cumulatives in excess of 2.5 in. (63.5 mm) (Figure 2b). Additional study is needed to verify the apparent relationship and examine possible causes.
As previously mentioned, the 3-day
and prior 15-day threshold is based on an analysis of 91 historical landslides
that were part of events with 3 or
more
landslides in a 3 day period in Seattle (Chleborad, 2000). It was assumed
in the initial study that, at that level of activity, precipitation played
a major
role in the development or triggering of the landslides. In the database
of 66 landslides compiled for this analysis, 42 occurred in Seattle and
24 occurred
in neighboring areas outside the city. Twenty-one of the slope failures
that occurred in Seattle can be shown to be part of events with 3 or more
slides
in a 3 day period (Tables 1, 2, 3, and 4). A plot of antecedent precipitation
totals for the 21 Seattle landslides that meet the original criteria indicates
two of the plotted points have error bars that cross the threshold and
thus are not definitive (Figure 14). Of the
remaining 19 estimates, 89% (17 of
19) plot above the threshold (Figure 14).
The high percentage of occurrences above
the threshold is consistent with results of previous analyses based on
the original database of 91 landslides (Figure 2a) and the expanded database
of 198 historical landslides (Figure 2b). The lower percentage of landslides
(68%)
that fall above the threshold in the dataset of 38 landslides (Table
5)
may
be explained, in part, by the inclusion of landslides that are not part
of events with 3 or more landslides in a 3-day (72 hr) period.
A plot of antecedent precipitation
totals for the 21 Seattle landslides that meet the original criteria indicates
two of the plotted points have error bars that cross the threshold and
thus are not definitive (Figure 14). Of the
remaining 19 estimates, 89% (17 of
19) plot above the threshold (Figure 14).
The high percentage of occurrences above
the threshold is consistent with results of previous analyses based on
the original database of 91 landslides (Figure 2a) and the expanded database
of 198 historical landslides (Figure 2b). The lower percentage of landslides
(68%)
that fall above the threshold in the dataset of 38 landslides (Table
5)
may
be explained, in part, by the inclusion of landslides that are not part
of events with 3 or more landslides in a 3-day (72 hr) period.
Most of the slope failures that occurred during the 2001 - 2002 and 2002 - 2003 wet seasons (Tables 1 and 3) are associated with storms that impacted the Seattle area between November 13 and December 16 of 2001. As indicated in Figures 7 and 8, conditions were generally above the threshold from November 13 to December 19, 2001. Nine of the slope failures (no.s 6, 10 through 14, 20, 22, and 23 in Table 1) occurred in northeast Seattle within 2 mi. (3.2 km) of City of Seattle rain gauge no. 2.
Figure 15 shows the history of
cumulative rainfall and rainfall intensity in northeast Seattle during the
period November 13 - 26, 2001 (color
coded line)
in relation to landslide occurrence (triangles) and the 3-day and
prior 15-day cumulative precipitation threshold for landslides (dashed red
line). Rainfall
intensity categories are shown in the table of color coded values
on
the right side of the graph. 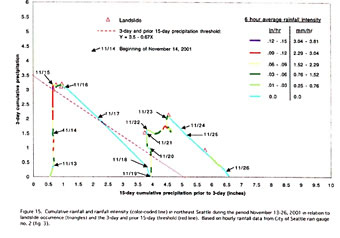 Arrows indicate rainfall intensity and
3-day and
prior 15-day
cumulative totals at the beginnings of the indicated days. Color-coded
line segments between arrows indicate intensities that occurred during
the successive
24 hr periods. Time scale (not shown) varies along the color-coded
line. Rainfall intensities and 3-day and prior 15-day antecedent
precipitation indicated by
the trajectory are based on hourly rainfall data from City of Seattle
rain gauge no. 2 (Figure 3).
Arrows indicate rainfall intensity and
3-day and
prior 15-day
cumulative totals at the beginnings of the indicated days. Color-coded
line segments between arrows indicate intensities that occurred during
the successive
24 hr periods. Time scale (not shown) varies along the color-coded
line. Rainfall intensities and 3-day and prior 15-day antecedent
precipitation indicated by
the trajectory are based on hourly rainfall data from City of Seattle
rain gauge no. 2 (Figure 3).
As indicated by the trajectory, an initial storm front brought rainfall to the area during the period November 13 - 15. During that interval the 3-day cumulative rainfall total rose above the threshold to 3.3 inches (84 mm). The 6-hour mean rainfall intensity reached a high of 0.13 in/hr on the afternoon of November 14. Landslides (triangles) occurred in northeast Seattle on November 14 and 15. All but one of the slides occurred when the 3-day/prior 15-day cumulative rainfall totals were at or above the threshold. The initial storm ended November 15 and little or no rain fell between November 16 and 19. On November 19 the 3-day cumulative had dropped to zero and the prior 15-day cumulative total had risen to nearly 4 inches.
A series of storm fronts brought additional rain to the area during the period November 19 - 23. As shown on the graph, the 3-day cumulative total rose to 2.1 inches and the prior 15-day rose to over 4.5 inches. Six-hour mean rainfall intensity reached a maximum of 0.11 in/hr on November 22. Landslide activity occurred on November 21 and 23 and during the weekend of November 24-25 when conditions were above the 3-day/prior 15-day precipitation threshold and rainfall intensities were less than or equal to 0.06 in./hr (1.52 mm/hr).
Compilation and analysis of Seattle area precipitation and landslide data for the 2000 - 2001, 2001 - 2002, and 2002 - 2003 wet seasons has revealed the following: 1) consistent with previous findings, a high percentage (89%) of Seattle landslides in the evaluation that were part of events with 3 or more landslides in a 3-day period occurred when conditions were above the threshold. 2) a lessor percentage (68%) of landslides in a dataset that includes all landslides in Seattle and surrounding areas, regardless of associated level of landslide activity, occurred when conditions were above the threshold, 3) a majority of landslides that occurred below the threshold had a reported or identified human influence; suggesting that, for the purpose of threshold identification, landslides with a significant human influence should be considered separately from landslides that occur under natural conditions, 4) the rainfall history graph developed in this study (Figure 15) is useful for visually examining relationships between landslide occurrence, 3-day and prior 15-day antecedent rainfall, rainfall intensity, and the precipitation threshold. Generation of similar graphs based on real-time or near real-time rainfall data are potentially useful as part of a web-based landslide advisory or early warning system. Also, construction of similar graphs for other historical landslide events combined with statistical analysis of related antecedent precipitation and rainfall intensity may be useful in efforts to determine probabilities of landslide occurrence relative to the threshold.
Distances between landslides and corresponding rain gauges (Tables 2 and 3) have a mean value of 2.9 mi. (4.6 km), and a standard deviation of 2.2 mi. (3.5 km). However, the issue of rainfall spatial variability has not been addressed in this study and it is unknown whether or not variability over the distances involved can significantly affect estimates of 3-day and prior 15-day precipitation. In addition, variability and possible errors associated with rain gauge type have not been examined. For example, snowfall and wind conditions may significantly affect data accuracy. Landslide prone areas in Seattle and vicinity have been mapped or identified in numerous studies and landslide recurrence intervals for the areas have been estimated (e.g. Tubbs, 1974; Laprade and others, 2000, Baum and others, 1998; and Coe and others, 2000). If variability with distance is a significant factor, deployment of rain gauges in known landslide-prone areas or areas with a high frequency of landslide occurrence could significantly reduce distances between future landslides and rain gauges used to estimate amounts of antecedent precipitation and rainfall intensity, thus improving the rainfall estimates.
Currently, near real-time updates on conditions in the Seattle area relative to the 3-day and prior 15-day threshold are provided on the web (http://landslides.usgs.gov/html_files/ofr-00-0469/seattlenet.html). A link to the National Weather Service, Seattle web site allows users to easily access standard, short-term precipitation forecasts for the Seattle area. The combination of current updates relative to the threshold and the NWS precipitation forecasts provides users with a crude method of anticipating future conditions relative to the threshold. However, numerical precipitation forecasts are needed to adequately project future conditions. A web-based numerical weather forecast (MM5) for areas of the Pacific Northwest is currently provided by the University of Washingtion's Department of Atmospheric Sciences (http://www.atmos.washington.edu/mm5rt). Future work plans related to this study include an investigation to examine the possibility of integrating the numerical forecasts with precipitation measurements in the Seattle area in order to forecast conditions relative to the precipitation threshold.
Individuals with the City of Seattle that generously provided useful information
and helpful discussion include: Rex Allen, Herb Alwine, Bill Benzer, Charles
Bookman, Jim Dare, John Ege, Robin Friedman, Hirod Gill, Stu Lorimer, Rob McIntosh,
Mark Orth, Brian Smith, Greg Stevens, and Kieth Ward. Douglas Olsen, a resident
of Bainbridge Island, Washington contributed valuable precipitation data. Their
help is greatly appreciated. I thank Bill Laprade and Hollie Ellis of Shannon
and Wlson, Inc. for helpful discussions during the course of the study. U.
S. Geological Survey collueagues Rex Baum and Bill Schulz contributed thoughtful
reviews of this report.
Baum, R.L., Chleborad, A.F., Schuster, R.L., 1998, Landslides triggered by the winter 1996-97 storms in the Puget Lowland, Washington: U.S. Geological Survey Open File Report 98-239, 16 p.
Chleborad, A.F., 2000, A method for anticipating the occurrence of precipitation-induced landslides in Seattle, Washington: U.S. Geological Survey Open-File Report 00-469, 29 p.
Church, P.E., 1974, Some precipitation characteristics of Seattle: Weatherwise, December, p. 244-251.
Coe, J.A., Michael, J.A., Crovelli R.A., and W.Z. Savage, 2000, Preliminary map showing landslide densities, mean recurrence intervals, and exceedance probabilities as determined from historic records, Seattle, Washington: U.S. Geological Survey Open-File Report 00-303, 29 p., 1 pl.
Cruden, D.M. and Varnes, D.J., 1996, Landslide types and processes: in Turner, A.K. and Schuster, R.L., Landslides - Investigations and Mitigation, Transportation Research Board Special Report 247, p. 36 - 75.
Laprade, W.T., Kirkland, T.E., Nashem, W.D., and Robertson, C.A., 2000, Seattle landslide study, Shannon and Wilson, Inc. Internal Report W-7992-01, 164 p.
National Climatic Data Center, 2000 -2003, Local climatological data: Washington, October - April.
Pageler, M, 1998, Landslide Policies for Seattle: A report to the Seattle City Council from the Landslide Policy Group, M. Pageler, chair, 35 p.
Tubbs, D.W., 1974, Landslides in Seattle: Washington Division of Geology and Earth Resources Information Circular 52, 15 p., 1 plate.
| AccessibilityFOIAPrivacyPolicies and Notices | |
| |
|