Prepared by Marshall Frech, Director of FloodSafety.com
Report Overview
Texas leads the Nation in flash flood fatalities with more than
twice the number of the next nearest state. Some major factors
contributing to this fact are Texas' extreme flood events and
the fact that Texas has one of the largest road systems in the
country. These roads have many rural and urban low-water crossings
and this is where the majority of flood-related fatalities occur.
The fact that so many people drive to their death in floodwaters
year after year is a major impetus for this report and has lead
this research on some larger issues and patterns underlying flood
fatalities.
This report is broken into two sections:
Part 1: A Description of the Flood Safety Problem
An outline of conditions that surround flood fatalities, such as driver
desensitization to driving through water, misunderstanding of the power
of water and/or the danger of a flooding vehicle. This section also
includes a seven-stage analysis of common events and human perceptions
and behaviors surrounding a flood event.
Part 2: Who's at Danger
A look at some of the statistics of flood fatalities and a description
of the most common types of fatalities.
Table of Contents
Part #1: A Description of the Flood Safety Problem
Texas Weather
The State of Texas lies in close proximity to both the Atlantic
and Pacific Oceans and its seasonal weather patterns draw major
storms from both water bodies as well as the North American landmass.
Occasionally, storms coming from both oceans "collide"
over the State producing record rainfalls. It might surprise many
Texans to know that their State has experienced about half of the
world record rainfall rates occurring in 48 hours or less (Raymond
Slade, USGS).
(EX: On May 31, 1935 D'Hanis, Texas received 22 inches of rain in 2
hrs, 45 minutes. This is a world record for rainfall in that duration
of time.)
Beyond the severity of storms colliding, sections of the State
lie in areas where storms frequently stall and drop torrential rains.
Central Texas is known as "Flash Flood Alley" for this
reason. Stalled storm systems and storm events occurring in rapid
succession can saturate watershed soils, which then direct large
amounts of water very quickly downhill, via either an established
waterway or simply a low-lying area. Even small, intermittent creeks
and low-lying swales can gather large amounts of water if the storm
drops into their particular watershed. These features can quickly
turn into instant rivers and send deadly waters across roadways
and through houses where there are little or no warning signs.
Geology and Size of Watershed
Size of watershed and its underlying geology profoundly affect both
the amount of water and the rapidity of the runoff causing a flash
flood. Intense, sudden rainfall can overwhelm the land's capacity
to absorb rainwater. In much of Central Texas, the Edwards Limestone
formation and a thin-to-nonexistent layer of topsoil cannot absorb
intense rainfall; this geology encourages rapid, runoff of rainwater
(Barton Creek Report, City of Austin, 1997). This means low-water
crossings and creeks near roads can change character quickly, even
in minutes, after heavy rain.
Miles and Miles of Rural Roads and a General Desensitizing to Low-Water
Crossings
In addition to having one of the largest road systems in America,
Texas also possesses many low-water crossings, owing in part to
the largely rural nature of its roads (Roy Sedwick, phone conversation,
4 Aug. 1999). Flood-prone roadways, marked with yellow diamond signage
(Caution: Roadway subject to flooding), and flood gages, are traversed
daily by countless Texas drivers without incident. In urban settings,
low-water crossings are frequently obscured by urban road infrastructure
such as storm drains, pavement and culverts. In both urban and rural
settings, low-water crossings—or potential low-water crossings—may
be unmarked or poorly marked.
In many rural parts of Texas, thousands of drivers will regularly drive
through wet low-water crossings with a foot of water from streams that
run for days or even weeks after a storm has passed and all apparent danger
is gone. With some drivers making hundreds of crossings in a month, it
is easy to see how they might become conditioned to crossing standing
water. Later, as a flooding landscape brings about a sense of urgency
to get home or to get to other family members, these same drivers might
not make the important distinction between a bridge covered with muddy
water that appears to be a foot deep but is actually several feet deep.
Other Flood Safety Concerns
During a flood, ordinary creeks can become objects of ill-advised curiosity.
Onlookers venturing too close have been known to fall into floodwaters
as soggy, eroded river banks give way without warning.
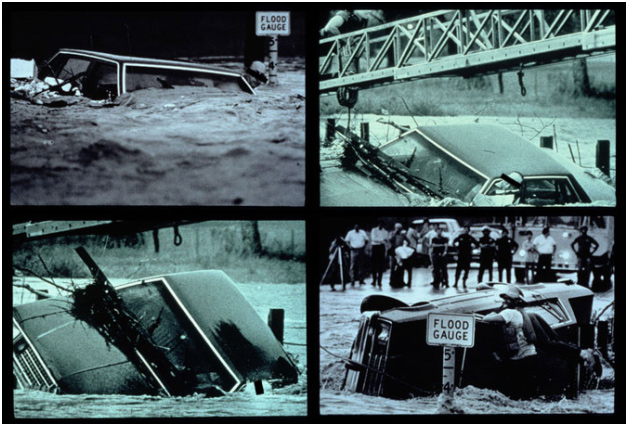
The sequence seen above is all too common. This man has driven into a
low-water crossing. His car is caught in the current and swept along.
The car begins to role and the man is trapped. Despite their heroic efforts,
the rescuers are unable to get to him in time. The man drowned.
The Anatomy of a Flood (a Breakdown of Events)
As a method for describing the problem at hand, this report uses
a seven-stage analysis of a flood event. These seven stages delineate
the events and situations surrounding major floods. They also describe
the general public's desensitization to the dangers of flooded roadways
and other factors behind the life-threatening behavior exhibited
by many drivers during flood events. These stages are also introduced
as a tool for targeting educational objectives such as flood safety
awareness campaigns and specific programs like driver safety training
in high schools.
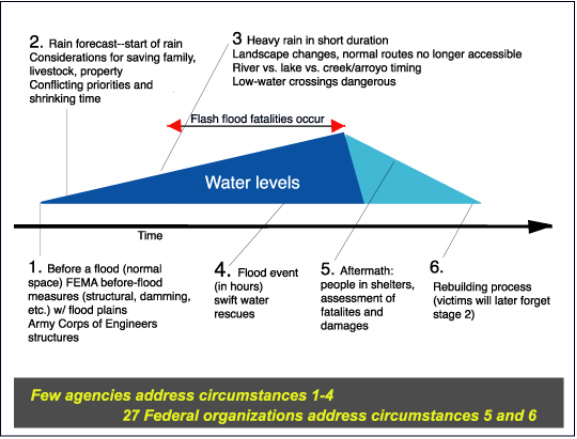
The stages are:
1. Normal Life Before a Flood
2. Rain Forecast and Start of Rain
3. Substantial Rainfall and Saturation of Watershed
4. Flood Event
5. Flood Aftermath
6. Rebuilding Process
7. Resumption of Normal Life, as in 1
Stage #1 Normal Life Before a Flood
Preconceived notions and exposure to the facts and factors of floods.
This period, before any flood emergency begins, is the best time
to save lives in Texas. Understanding what the public knows about
flooding, and what it thinks is acceptable or acceptably risky behavior
during a flood event, particularly while driving, is crucial. It
is likely that the public's unfamiliarity with flood fatality statistics,
how rapidly floodwaters rise and the accompanying level of danger
even as one occupies the seeming security and comfort of one's car
all contribute to a lack of proper respect regarding floodwaters.
The public may also believe that flood control mechanisms may provide
additional safety, regardless of the volume of water in a storm
event. Since flooding has some seasonal predictability, educational
programs should be started before this normal flooding cycle commences.
Stage #2 Rain Forecast and Start of Rain
This stage represents an opportunity to publicize safety information
with the public increased interest in weather forecasts (i.e. a website
is publicized at the end of a broadcast).
The majority of the public receive their receive their weather information
from mass media. Television, radio, and newspaper forecasts usually mention
the potential for flash flood warnings if the weather conditions and immediate
weather history warrant it.
It should be noted here that these media messages could be supplemented
with additional detailed flood safety information. It is in this time
period that people may first consider plans for family, livestock and
property. If weather forecasts with flash flood warnings are issued within
a short time frame, people who wish to begin protecting family, livestock
and property may find it difficult to do so in the short time allotted.
Stage #3 Substantial Rainfall in Progress
Unforeseen priorities arise, the pace of events increases dramatically.
This period can be marked by continuous medium rain, or a light
rain that saturates the soils then turns heavy. As these patterns
play out, people often begin to make arrangements to protect family,
livestock and property, and may neglect flood warnings and other
obvious warning signs.
A turning point is reached when the ground is fully saturated—a
flood event could be possible at any moment beyond this point, with
the significant variables being volume of rainfall and size of watershed.
This is can be a very short period, and it is generally too late
to begin any sort of efforts that might affect human behavior. People
can begin to panic at any part of this stage, resulting in impaired
decision-making capabilities. The concept of Panic is defined as
a belief that there are no options, and otherwise irrational reactions.
Stage #4 The Flood Event
The severity of the flood event is an outcome of the intensity
and duration of Stage 3 in relation to the geography of the watershed.
Small watersheds can flash very quickly. Large watersheds can catch
tremendous amounts of water. Both can produce deadly results.
As this dramatic period begins, not only does the landscape change
but so do people's priorities. Response times shrink as do options
to take alternative routes home. People may feel a sense of urgency
to travel to safe or higher ground, or check on family members or
property. There are many stories of people dying while making desperate
attempts to get home, while staying put would have been the safer
option. Further study of human behavior and motivations during this
time period would aid greatly in educational and public relations
efforts to reduce flood fatalities incurred here. This is the most
dangerous time period in the stage of a flood, and arguably for
Texas drivers at low-water crossings the most treacherous, as low-water
crossings change from passable to deadly.
Residents living on lakes and dam-controlled rivers may get advanced
warning of flood events. Those living near intermittent, seasonal
creeks and streams do not usually receive much advance warning about
flooding, usually because these smaller water bodies are less carefully
monitored. Unfortunately, people usually have no idea how much water
can come down their small nearby streams. In the past 10 years,
Austin's intermittent Barton Creek has twice flowed at over 12,000
cubic feet per second, which is half the average daily flow of the
Colorado River through the Grand Canyon (USGS gage reports December
1991, October 1998).
Flood events differ in duration; most rivers and man-made lakes
are monitored by local and regional entities, and man-made controls
installed on many of these bodies of water make flood prediction
more precise than flood timing for creeks, arroyos and the like.
Most people never see a flood event because they have retreated
from outdoors to shelter. Unconnected from direct experience with
the flood event or exposed to proof (photographs, video footage
and statistics), public safety advice and flood warnings may take
on a rather vague, abstract quality easily forgotten.
Stage #5 The Flood Aftermath
Many agencies have been geared up to step in during this period.
Flood victims have been given places in shelters operated by relief
agencies such as the American Red Cross, FEMA, and State agencies
like Texas Department of Public Safety's Division of Emergency Management.
These and other agencies are responsible for the recovery of human
and animal fatalities, addressing issues such as water contamination
and repairing broken septic systems. Due to the dramatic nature
of this time period, media attention is high; human interest stories
about flood victims are frequently featured.
One FEMA official told the Texas Environmental Center that 27 distinct
Federal agencies have programs that assist after a flood, but few
if any are designed to take actions before a flood.
Stage #6 The Flood Rebuilding Process
Indefinitely long, this period is used to assess fatalities and
damages. FEMA designates Texas counties for Federal aid and there
may be Presidential orders for further assistance after reviewing
the agency's analysis of the State's request for Federal relief.
The declaration covers damage from the severe thunderstorms and
flooding. FEMA coordinates grants to help pay for temporary housing,
minor home repairs and other serious disaster-related expenses.
Low-interest loans from the U.S. Small Business Administration are
also available to cover residential and business losses not fully
compensated by insurance. Under the presidential declaration, Federal
funds are provided for the State and affected local governments
in the affected designated counties to help pay for approved projects
that reduce future disaster risks. As concerns focus on returning
victims' lives back to normal, lessons learned about flash flooding
can begin to be forgotten. It should be noted that were flood education
measures to be taken in this time period, these measures would be
most effective when they take place before reconstruction of damaged
property begins. ("Once they pick up a hammer and start rebuild,
they forget about what has happened"—Roy Sedwick, Lower
Colorado River Authority).
Stage #7 Normal Life Resumes
As in Part 1. The catastrophe finally having been addressed, flood
victims are anxious to get on with daily living, grieving, etc.
If people didn't see the flood event or didn't directly experience
it, their learning of lessons about flood safety might be minimal.
It can be years between flood events, years which can be interspersed
with drought, further contributing to the public's forgetting of
the power and danger of floods. The public may also relax its collective
guard if it thinks that it has seen and recovered from all the flood
events it is going to have for the season. This is can be a dangerous
attitude as well. Within a single year, 1998, three consecutive
presidential disaster declarations were made in as many months in
Texas: Tropical Storm Charley & Related Flooding (Aug. 26, 1998),
Tropical Storm Frances & Related Flooding (Sept. 18, 1998),
and Flooding (Oct. 20, 1998) (source: Division of Emergency Management,
Texas Department of Public Safety, from Jo Moss).
Part#2: Who's at Danger (Incident and Fatality Statistics)
High Risk Groups
Texas leads the nation in flash flood fatalities, with 612 flood-related
fatalities recorded between 1960-1995 (Figure 3). Statistics regarding
these flood fatalities reveal over half of all human mishaps with
floodwaters are vehicle-related. These data include both fatalities
and incidents, whether the drivers and passengers perished or were
saved by swift-water rescue teams.
Preliminary figures for 1995 (Roy Sedwick, Lower Colorado River
Authority, written commun., 1999) show that 79 people lost their
lives in flash floods/floods of which 55% were vehicle-related.
Texas had 34% of the 1995 fatalities. Of the 79 deaths, 73% were
male with an average age of 34 years old, while females averaged
37.8 years old. Most of the years with the greatest number of flash
floods/floods can be directly related to the years with major land
falling hurricanes, "Betsy" in 1965, "Camille"
in 1969, and "Agnes" in 1972, (Flash Flood/Flood Fatalities
1960 Through 1995, Roy Sedwick, 1999).
During October 1998, the Division of Emergency Management, Texas
Department of Public Safety shows 10 incidents involving flood casualties:
of these 8 were vehicle-related, the remaining 2 were tornado-related
(Figure 2). Subsequent reporting could include more flood-related
fatality and incident statistics for further study. These statistics,
if available, would address questions about incidents and fatalities
involving trucks/sport utility vehicles versus all automobiles,
rural versus urban environments, and times of day during which incidents
and fatalities occur.
Rural Vs Urban Flooding Dangers
Flooding affects both urban and rural residents, although not in
the same ways. With so much impervious cover, the urban environment
can quickly engender rapid runoff during a storm—runoff water
will readily flood road surfaces and impervious cover. Urban residents
and drivers frequently traverse low-water crossings and roads near
creeks and drainage ditches as part of the urban watershed environment.
Many of the watershed features may be hidden by buildings, parks,
and urban street features such as culverts and ditches. Because
it is not possible to predict where the rainwater from a storm event
is going to concentrate, it is not possible to know where the most
dangerous places are going to be. Even urban areas that feature
more flood controls than rural areas can become dangerous. On the
other hand, urban drivers frequently have the option of alternate
routes of travel, and the concentrated urban infrastructure allows
crucial police and fire department personnel and other emergency
response services to aid victims quickly.
Rural residents often have few choices of travel routes. While
having the same concerns about flooding that urban residents have,
rural residents may also be responsible for herds of livestock,
which can place additional demands on the short supply of time during
a flood crisis. Rural drivers stranded on roadsides may have no
access to facilities offering shelter, telephones, food, water or
fuel. Communication with rural residents on the road or in the field
may be through radio broadcast or not at all.
March 1998 Austin-American Statesman headline "Flood Restrictions
must be Enforced"—From the article: "The scene is
one that plays itself quite often in South Texas during heavy rainfall:
a vehicle approaches a roadway overflowing with water; the driver
assesses the water level, then daringly proceeds, with disregard
for the danger and, often, even barricades.
On October 17, 1998, Devine, Texas resident Kathleen McCoy was
traveling on a Caldwell County road with her two young sons and
family friend, Heather Cottle, 11, when she encountered a flooded
bridge over Brushy Creek. Even her Chevrolet Suburban was no match
for the swift water. It was recovered three days later under 27
feet of water. McCoy and her youngest son survived. Heather and
McCoy's oldest boy drowned. A grand jury last month indicted McCoy
on a charge of manslaughter, a felony that could spell a 20-year
prison sentence" (March 5, 1999, Austin American-Statesman).
October 1998 flooding claimed 31 lives, most of which involved
people whose vehicles were swept away by floodwaters. "This
is a grim reminder that the overwhelming majority of flood-related
deaths in Texas each year involve motor vehicles," noted Tom
Milwee, Governor's Division of Emergency Management, Texas Department
of Public Safety State Coordinator. "People who attempt to
drive through or near flooded roadways often place themselves, their
passengers and rescue and rescue workers in danger," he said.
"As emergency managers and first responders, it is incumbent
on us to continually remind people of the dangers of floods and
flash floods, especially when they travel." (Emergency Management
Digest, July-December 1998.)
Common Mistakes
Drivers underestimate how little water makes a car buoyant. Two
feet of water will carry away most automobiles, a fact few drivers
may know and appreciate. Water weighs 62.4 lbs. per cubic foot and
typically flows downstream at 6 to 12 miles an hour. When a vehicle
stalls in the water, the water's momentum is transferred to the
car. For each foot the water rises, 500 lbs. of lateral force are
applied to the car. But the biggest factor is buoyancy. For each
foot the water rises up the side of the car, the car displaces 1,500
lbs. of water. In effect, the car weighs 1,500 lbs. less for each
foot the water rises (FEMA web site). Three-inch rainfalls in the
Dallas and Houston metro areas caused serious flooding during April
24-26, 1990 (Flash Flood/Flood Fatalities 1960 Through 1995, Roy
Sedwick, 1999). Drivers of vehicles with higher ground clearance
may feel safer, more inclined to drive through minor or other flooding
at low-water crossings.
It should be noted that these vehicles are often marketed (vis-à-vis
TV ads) as capable of crossing water safely. More analysis of flood
fatality statistics is needed to determine the extent to which these
vehicles are involved in deadly engagements with the power of moving
water.
When required to evacuate an area, drivers may wait too long and
then feel "forced" to cross flooded roads. As discussed
in Anatomy of a Flood, people can panic during Stage #3 (Substantial
Rainfall in Progress ) and Stage #4 (Flood Event) as they feel the
pressures of time and responsibility. Compounding factors may include
volume of traffic on roadways and the timeliness with which at-risk
drivers receive crucial flood information.
Drivers may drive too fast in low visibility conditions, reducing
reaction time.
Flash floods can occur at any hour, but nighttime drivers facing
low-water crossings are especially endangered. Flood signage and
gages are less visible at night, and flooded low-water crossings
with no markers on curved roads and/or unlit rural roads can surprise
an unwary driver. Further, the depth of water on a flooded road
surface is especially difficult to determine in low-light conditions
(Roy Sedwick, 1999).
Drivers underestimate reaction time and/or handling as their car
quickly floats out of control.
The moment a vehicle's tires leave the pavement, a driver is no
longer in control of his vehicle. Any coping strategies such a driver
might use to get back in control will be futile. Vehicles equipped
with four-wheel drive may encourage the mistaken notion among drivers
that such vehicles will handle better in a crisis situation.
Drivers don't know what safety measures to take once their cars
are out of control. Once their cars are buoyant, few drivers may
know what their options are, i.e. whether to roll down windows and
evacuate the vehicle, or stay and wait for help. People can underestimate
or overestimate the depth of the water they've become stuck in as
well.
Flood Fatality Statistics
From Federal Disaster Declarations and Emergency Declarations in Texas
in 1998
(DIVISION OF EMERGENCY MANAGEMENT, TEXAS DEPARTMENT OF PUBLIC SAFETY)
Top sixteen flash flood/flood fatality states, 1960-1995
Number of fatalities
1. TEXAS - 612
2. CALIFORNIA - 255
3. SOUTH DAKOTA - 248
4. VIRGINIA - 241
5. WEST VIRGINIA - 240
6. PENNSYLVANIA 188
7. MISSISSIPPI - 181
8. COLORADO - 168
9. LOUISIANA - 149
10. MISSOURI - 122
11. GEORGIA - 112
12. NEW YORK - 107
13. OHIO - 102
14. ARIZONA - 96
15. KENTUCKY - 93
16. TENNESSEE - 91
Source: Roy Sedwick, Lower Colorado River Authority, written commun.,
1999
Flood-Related Bibliography
In Print
Division of Emergency Management, Texas Department of Public Safety.
Federal Disaster Declarations and Emergency Declarations in Texas in 1998.
June 13, 2001
FEMA, National Flood Insurance Program. In the Event of a Flood: Tips
to Reduce Loss of Life and Property… 593-237D (12/94).
FEMA. Project Impact: Building a Disaster Resistant Community.
Spring 1998.
KVUE 24 Pinpoint Weather/LCRA. Weather Safety Guide. 1999.
LCRA. The State of the River. 1995.
LCRA. Colorado River Flood Warning Guide. No date.
LCRA. Drop by Drop: The Life Cycle of the Lower Colorado. No date.
LCRA/FEMA. Flooding on the Colorado River: Current Danger. 1992.
LCRA, EMS of COA, HEB, KTBC-TV, State of Txeas EM, LCRA Rangers, Pflugerville
VFD, Friends of the Colorado River Foundation. Danger: Flooded Roadway
Ahead. No date.
NFIP/FEMA. Weather Patterns Are Changing, and So Are Your Chances
of Being Flooded. F-0323, August 1998.
NOAA, FEMA, American Red Cross. Flash Floods and Floods…the Awesome
Power: A Preparedness Guide. US Department of Commerce, National Oceanic
and Atmospheric Administration, National Weather Service. July 1992.
NOAA. NOAA Weather Radio… the Voice of the National Weather Service.
US Department of Commerce, National Oceanic and Atmospheric Administration,
National Weather Service. March 1997
Sedwick, Roy. FLASH FLOOD/FLOOD FATALITIES: 1960 THROUGH 1995:
UNITED STATES, PUERTO RICO AND THE VIRGIN ISLANDS. Rough Draft.
1999. From LCRA Storm Data.
Texas Water Development Board. Texas Water Facts. TWDB 91-0166.
1991.
USGS/B.D. Jones. Texas Floods and Droughts. National Water Summary
1988-89. US Geological Survey Water-Supply Paper 2375.
USGS/US Dept of the Interior. Stream Gaging and Flood Forecasting:
a Partnership of the US Geological Survey and the National Weather
Service. Fact Sheet FS-209-95. August 1995.
USGS/US Dept of the Interior. Floods in South-Central Texas,
June 1997. USGS Fact Sheet FS-053-98. May 1998.
USGS/Water Resources Division. Flood-Related Actvities in Texas.
1996.
On Video
KVUE
KVUE Weather: Nature's Fury: Surviving the Storm
National Weather Service
The Hidden Danger, Low-Water Crossings
RT N/A
NOAA, FEMA, American Red Cross
The Awesome Force
RT 17:15
LCRA
The Flood of 1991
RT 23:46
LCRA
Flash Floods: A Warning to Beware
RT 16:00
LCRA
Wirtz Dam Update
December 17, 1997
The Evolution of Flood Management
1/21/98
RT 12:00
LCRA
Fixing the Floodplain
DEC 1998
RT 14:30
LCRA
Wavelength-Flood of '98 Story
NOV 1998
RT n/a
LCRA
Weather and the Colorado River
RT 13:30
LCRA
Dam Modernization: A 15-Year Program for the Highland Lakes Dams
RT 16:00
KVUE -TV/LCRA
Lake Travis: Hidden Dangers
RT: 28:36
US Interactive, Houston Texas.
USA Driving Safety Course
1996
RT: 6:00:00
On the World Wide Web
California Flood Information
http://ceres.ca.gov/flood/
FEMA: Flash Floods: How Can a Foot or Two of Water Cost You Your Life?
http://www.app1.fema.gov/NWZ96/autofld.htm
FEMA: Floodplain Management Summary
http://www.app1.fema.gov/mit/fldmit.htm
FEMA: National Mitigation Strategy
http://www.app1.fema.gov/mit/ntmstrat.htm
The Flood Control District of Maricopa County
http://www.fcd.maricopa.gov/
Interactive Weather Information Network
http://iwin.nws.noaa.gov/iwin/graphicsversion/rbigmain.html
National Oceanic and Atmospheric Administration
http://www.noaa.gov/
National Climatic Data Center
http://lwf.ncdc.noaa.gov/oa/ncdc.html
TEEX : Texas Engineering Extension Service
http://TEEXweb.tamu.edu/index.html
Texas Water Resources Institute
http://twri.tamu.edu/
TexasWaternet Subject Index (FLOOD)
http://twri.tamu.edu/subjindex/contents.html
Texas Department of Transportation
http://www.dot.state.tx.us/
Texas Association of County Engineers and Road Administrators
http://teexcit.tamu.edu/texasltap/tacera/faq.html
USGS—Water Resources of the United States
http://water.usgs.gov/
The Weather Channel—Project SafeSide: Flood and Flash Flood
Safety
http://www.weather.com/safeside/flood/?par=kaching&site=wx&promo=flood
|
