I. Description of Data Collection Methods. 5
I. Description of Data Collection Methods. 13
DATA COLLECTED BY SONOMA COUNTY WATER AGENCY NATURAL RESOURCE DIVISION.. 18
DATA COLLECTED BY SONOMA COUNTY WATER AGENCY NATURAL RESOURCE DIVISION.. 19
I. Description of Data Collection Methods. 19
DATA COLLECTED BY USGS, BRANCH OF REGIONAL RESEARCH, WESTERN REGION.. 23
I. Description of Data Collection Methods. 23
DATA COLLECTED BY THE USGS, CA DISTRICT. 28
I. Description of Data Collection Methods. 28
Figure 1. Site Location Map. 1
Figure 5. Stream stage above the inflatable Dam shown in figure 4. 14
Figure 6. Sample stream thermograph and stage hydrograph for KSG-OW-1. 17
Figure 7. Sample thermograph for surface water sites near Wohler Bridge and Inflatable Dam.. 21
Figure 11. River stage, discharge (streamflow), and thermograph from USGS Gage 11467000. 30
Table 2. Sample table from data collected under the direction of SCWA-ERP. 12
Table 3. Sample table from data collected by SCWA-ERP. 18
Table 4. Sample table from data collected by SCWA-NR.. 22
Table 5. Sample table from data collected by USGS- BRR, WR.. 27
Table 6. Sample table from data collected by USGS, CA District 31
| °C | degrees Celsius |
| cm | centimeters |
| ft | feet |
| gpm | (U.S.) gallons per minute |
| Guerneville | USGS Gage number 11467000 “RUSSIAN R NR GUERNEVILLE CA” |
| Healdsburg | USGS Gage number 11463980 “RUSSIAN R A DIGGER BEND NR HEALDSBURG CA” |
| Hopland | USGS Gage number 11462500 “RUSSIAN R NR HOPLAND CA” |
| kg | kilogram |
| km | kilometer |
| kPa | kilopascals |
| m | meters |
| m3/s | cubic meters per second |
| mbsb | meters below stream bottom |
| mi | mile |
| MP | shallow piezometer |
| OW | observation wellll |
| psi | pounds per square inch |
| PZ | shallow piezometer |
| Q | discharge (or pumping) rate in units of volume per time |
| S | stage |
| SCWA | Sonoma County Water Agency |
| SCWA-ERP | Sonoma County Water Agency, Engineering Resource and Planning Division |
| SCWA-NR | Sonoma County Water Agency, Natural Resource Division |
| SG | staff gage |
| T | temperature |
| TW | test well (prefaced by site abbreviation) |
| WL | water level (elevation) |
| Multiply | By | To obtain | |
|---|---|---|---|
| Density | |||
| megagrams per cubic meter (Mg/m3) | 1. | grams per cubic centimeter (g/cm3) | |
| megagrams per cubic meter (Mg/m3) | 62.4280 | pounds per cubic foot (lb/ft3) | |
| Length | |||
| kilometer (km) | 0.621371 | mile (mi) | |
| meter (m) | 3.28084 | foot (ft) | |
| meter (m) | 39.3701 | inch (in) | |
| millimeter (mm) | 3.93701 | hundreths of an inch (1/100 in) | |
| Rate | |||
| cubic meter per minute (m3/min) | 0.588578 | cubic foot per second (ft3/s) | |
| cubic meter per second (m3/s) | 35.3147 | cubic foot per second (ft3/s) | |
| cubic meter per second (m3/s) | 15850.32 | gallon per minute (gpm) | |
| Volume | |||
| liter (L) | 0.264172 | gallon (gal) | |
| million cubic meters (106 m3) | 810.710 | acre feet (acre-ft) | |
| Degrees Celsius (oC) can be converted to degrees Fahrenheit (oF) by using the formula:oF = [1.8*(oC)]+32. | |||
| Sea Levell | |||
| In this report, “sea level” refers to the National Geodetic Vertical Datum of 1929 (NGVD of 1929, formerly called “Sea-Level Datum of 1929”), which is derived from a general adjustment of the first-order leveling networks of the United States and Canada. | |||
1Conversion factors given to six significant figures, unless exact.
Temperature, water level elevation, stage height, and river discharge data for this report were collected in and adjacent to the Russian River from Hopland to Guerneville, CA over a four-year period from 1998 to 2002 to establish baselines for long-term water quality, water supply and habitat. Data files presented in this report were collected by the USGS and the Sonoma County Water Agency's Engineering Resource and Planning, and Natural Resource Divisions. Temperature data were collected in single-channel submersible microloggers or temperature data were collected simultaneously with water-elevation data in dual-channel down-hole data loggers. Stream stage and streamflow data were collected at USGS stream gaging stations located near Hopland, Healdsburg, and Guerneville over a 130 km reach of the Russian River. During the period of record stream flow ranged from 3 to 1458 m3/s. Stream temperature ranged from 8 to 29 oC while groundwater temperature ranged from 10 to 38 oC. Stream stage varied 5 m seasonly, while ground-water level varied 19 m over the same time scale.
The Russian River flows south from Mendocino County into Sonoma County, CA (fig. 1) for approximately 130 km before reaching the Pacific Ocean at Jenner, CA. In this reach of the Russian River northwest of the Santa Rosa Plain, a significant volume of stream water is exchanged with the alluvial aquifer before the river flows to the west.
Stream temperature patterns are important indicators of water and habitat quality. Stream temperature is monitored at all USGS National Water Quality Assessment sites throughout the United States. Recently, researchers have demonstrated that temperature patterns are useful for estimating water exchange between streams and underlying streambed materials. When water level in wells and stream stage are measured concurrently, the combined data maybe used to make quantitative estimates of water fluxes between the stream and the subsurface and to quantify streambed hydraulic properties (e.g., Constantz, 1998, Constantz and others, 2002). In conjunction with water level elevation measurements, temperature data collected in shallow piezometers and deep wells can be used to estimate the rate of streambed seepage, hydraulic conductivity, and conductance of the geologic materials that surround them (Stonestrom and Constantz, 2003). Streambed seepage is of particular interest for water resources management because it constitutes the largest contribution to recharge in many hydrologic basins. Unlike other tracers, daily heat variation is already present in natural systems (diurnal temperature variations can be seen in shallow piezometers and long-term seasonal temperature variations can be seen in deeper wells) and therefore has no environmental concerns associated with its use as a tracer. In addition, temperature data are relatively easy to collect, making this method of estimation of hydraulic properties widely accessible.
Water temperature data, water level elevation, stage height, and river discharge (table 1) are presented in this report. These data were collected in and adjacent to the Russian River from Hopland to Guerneville over a four-year period from 1998 to 2002 by either the USGS or Sonoma County Water Agency's Engineering Resource and Planning, and Natural Resource Divisions (fig. 1). These data provide baseline information that is useful for ongoing, long-term studies of stream and aquifer dynamics. Figure 2 is an example of a typical thermograph for data found in this report. Table 1 lists the sources, sampling locations, and time intervals for the data collected.
We would like to thank James Jasperse and Donald Seymour at Sonoma County Water Agency for providing data, funding and support for this project, and Brian Nguyen for help with USGS district data retrieval.
 |
| Figure 1. Site Location Map: A) Russian River, Northern Coastal California B) Study reach from Healdsburg to Guerneville, CA |
 |
| Figure 2. An example data set of temperature collected over time at four locations, three depths in a piezometer plus the overlying surface water. |
Table 1. Water temperature, streamflow and ground-water elevations in and adjacent to the Russian River between Hopland and Guerneville, CA
| SOURCE |
SITE |
DATE OF RECORD |
DATA TYPE |
FILENAME |
|||||||
| BEGIN DATE |
END DATE |
CURRENT |
ORIGINAL |
||||||||
| (CONSULTANT) |
Westside Farms |
9/22/1998 |
9/28/1998 |
T/WL |
WS_19980922.xls |
Westside Farms.xls |
|||||
| (CONSULTANT) |
Lazy W Ranch |
10/11/1998 |
10/19/1998 |
T/WL |
LW_19981011.xls |
Lazy 'W' Ranch_out.xls |
|||||
| (CONSULTANT) |
Riverfront Regional Park |
10/21/1998 |
10/27/1998 |
T/WL |
Riverfront_19981021.xls |
KSGMP_SGbck.xls |
|||||
| (CONSULTANT) |
Riverfront Regional Park |
10/26/1998 |
11/3/1998 |
T/WL |
Riverfront_19981021.xls |
Kaiser Sand & Gravel.xls |
|||||
| (CONSULTANT) |
Windsor |
10/29/1999 |
11/9/1999 |
T/WL |
WIN_19991029.xls |
TW-1mpsg.xls |
|||||
| (CONSULTANT) |
Windsor |
10/29/1999 |
11/9/1999 |
T/WL |
WIN_19991029.xls |
TW-2mpsg.xls |
|||||
| (CONSULTANT) |
Steelhead Beach |
9/22/2000 |
10/9/2000 |
T/WL |
SB_20000922.xls |
stelhddata.xls |
|||||
| (CONSULTANT) |
Hanson Aggregate |
10/29/1999 |
11/9/1999 |
T/WL |
HA_19991029.xls |
HA-OWs.xls |
|||||
| (CONSULTANT) |
Hanson Aggregate |
10/29/1999 |
11/9/1999 |
T/WL |
HA_19991029.xls |
HA-2mpsg.xls |
|||||
| (CONSULTANT) |
Hanson Aggregate |
10/29/1999 |
11/9/1999 |
T/WL |
HA_19991029.xls |
HA-1mpsg.xls |
|||||
| SCWA-ERP |
Wohler |
4/5/2000 |
2/21/2001 |
T/WL |
WB_20000405.xls |
mw9318.xls |
|||||
| SCWA-ERP |
Wohler |
4/5/2000 |
2/21/2001 |
T/WL |
WB_20000405.xls |
mww9314.xls |
|||||
| SCWA-ERP |
Wohler |
4/5/2000 |
2/21/2001 |
T/WL |
WB_20000405.xls |
tw1.xls |
|||||
| SCWA-ERP |
Wohler |
4/5/2000 |
2/21/2001 |
T/WL |
WB_20000405.xls |
tw13.xls |
|||||
| SCWA-ERP |
Wohler |
4/5/2000 |
2/21/2001 |
T/WL |
WB_20000405.xls |
tw8.xls |
|||||
| SCWA-ERP |
Wohler |
4/4/2002 |
11/28/2002 |
T/WL |
WB_20020404.xls |
MW-93-18_2002.xls |
|||||
| SCWA-ERP |
Wohler |
4/4/2002 |
12/13/2002 |
T/WL |
WB_20020404.xls |
MW-93-14_2002.xls |
|||||
| SCWA-ERP |
Wohler |
4/4/2002 |
12/18/2002 |
T/WL |
WB_20020404.xls |
TW-1_2002.xls |
|||||
| SCWA-ERP |
Riverfront Regional Park |
4/12/2002 |
12/7/2002 |
T/WL |
Riverfront_20020412.xls |
KSG-OW-1_2002.xls |
|||||
| SCWA-ERP |
Riverfront Regional Park |
4/12/2002 |
12/18/2002 |
T/WL |
Riverfront_20020412.xls |
LW-04_2002.xls |
|||||
| SCWA-NR |
Wohler |
6/10/1999 |
9/16/1999 |
T |
WB_19990610.xls |
Wohler temps-1999.xls |
|||||
| SCWA-NR |
Wohler |
6/1/2000 |
10/27/2000 |
T |
WB_20000601.xls |
Wohler temps-2000.xls |
|||||
| SCWA-NR |
Wohler |
4/26/2001 |
11/1/2001 |
T |
WB_20010524.xls |
Wohler temps-2001.xls |
|||||
| SCWA-NR |
Mirabel |
1/21/2002 |
12/31/2002 |
T/WL |
Mirabel_20020101.xls |
SCWA_sonde.xls |
|||||
| SCWA-NR |
Wohler |
3/9/2002 |
12/9/2002 |
T |
WB_20020601.xls |
2002 Daily bottom.xls |
|||||
| SCWA-NR |
Wohler |
6/1/2002 |
10/10/2002 |
T |
WB_20020601.xls |
2002 Daily surface.xls |
|||||
| USGS--BRR, WR |
Steelhead Beach |
9/22/2000 |
9/28/2000 |
T |
SB_20000928.xls |
steelhead2000.02.out.xls |
|||||
| USGS--BRR, WR |
Steelhead Beach |
9/26/2001 |
10/10/2001 |
T |
SB_20010926.xls |
steelheadwater.xls |
|||||
| USGS--BRR, WR |
Steelhead Beach |
9/26/2001 |
10/10/2001 |
T |
SB_20010926.xls |
4ftpiezone.xls |
|||||
| USGS--BRR, WR |
Steelhead Beach |
9/26/2001 |
10/10/2001 |
T |
SB_20010926.xls |
4ftpieztwo.xls |
|||||
| USGS--BRR, WR |
Steelhead Beach |
9/26/2001 |
10/10/2001 |
T |
SB_20010926.xls |
4ftpiezfour.xls |
|||||
| USGS--BRR, WR |
Steelhead Beach |
9/26/2001 |
10/10/2001 |
T |
SB_20010926.xls |
8ftpieztwo.xls |
|||||
| USGS--BRR, WR |
Steelhead Beach |
9/26/2001 |
10/10/2001 |
T |
SB_20010926.xls |
8ftpiezfour.xls |
|||||
| USGS--BRR, WR |
Steelhead Beach |
9/26/2001 |
10/10/2001 |
T |
SB_20010926.xls |
8ftpiezeight.xls |
|||||
| USGS--BRR, WR |
Riverfront Regional Park |
6/18/2002 |
9/9/2002 |
T |
Riverfront_20020618.xls |
sn164919_#4.txt |
|||||
| USGS--BRR, WR |
Riverfront Regional Park |
6/19/2002 |
9/9/2002 |
T |
Riverfront_20020618.xls |
sn142057_#7.txt |
|||||
| USGS--BRR, WR |
Riverfront Regional Park |
6/19/2002 |
9/9/2002 |
T |
Riverfront_20020618.xls |
sn142062_#5.txt |
|||||
| USGS--BRR, WR |
Riverfront Regional Park |
6/19/2002 |
9/9/2002 |
T |
Riverfront_20020618.xls |
sn186330_#6.txt |
|||||
| SOURCE KEY: |
DATA TYPES: |
||||||||||
| SCWA - ERP |
Sonoma County Water Agency -Engineering Resources Planning |
T |
Temperature Data |
||||||||
| SCWA - NR |
Sonoma County Water Agency - Natural Resources |
WL |
Water Level Elevations |
||||||||
| USGS - BRR, WR |
USGS -Branch of Regional Research, Western Region |
Q |
Discharge (or Pumping) Data |
||||||||
| USGS - CA |
USGS - California District |
S |
Stage Data |
||||||||
Table 1. Water temperature, streamflow and ground-water elevations in and adjacent to the Russian River between Hopland and Guerneville, CA (Continued)
| SOURCE |
SITE |
DATE OF RECORD |
DATA TYPE |
FILENAME |
||
| BEGIN DATE |
END DATE |
CURRENT |
ORIGINAL |
|||
| USGS--BRR, WR |
Wohler (2ft) |
6/19/2002 |
9/9/2002 |
T |
WB_20020619.xls |
sn187689_#2.txt |
| USGS--BRR, WR |
Wohler (H2O) |
6/19/2002 |
9/9/2002 |
T |
WB_20020619.xls |
sn187695_#3.txt |
| USGS--BRR, WR |
Wohler (1ft) |
6/19/2002 |
9/9/2002 |
T |
WB_20020619.xls |
sn187713_#1.txt |
| USGS--BRR, WR |
Wohler (2ft) |
9/9/2002 |
10/31/2002 |
T |
WB_20020619.xls |
wohl_sn187689_oct.txt |
| USGS--BRR, WR |
Wohler (1ft) |
9/9/2002 |
10/31/2002 |
T |
WB_20020619.xls |
wohl_sn187713_oct.txt |
| USGS--BRR, WR |
Wohler (H2O) |
9/9/2002 |
11/27/2002 |
T |
WB_20020619.xls |
wohl_sn187695_nov.txt |
| USGS--BRR, WR |
Wohler (2ft) |
10/31/2002 |
10/31/2002 |
T |
WB_20020619.xls |
wohl_sn187689_nov.txt |
| USGS--BRR, WR |
Wohler (1ft) |
10/31/2002 |
11/27/2002 |
T |
WB_20020619.xls |
wohl_sn187713_nov.txt |
| USGS-CA |
Guerneville Gage |
1/1/1998 |
12/31/1998 |
S |
Guerneville_20021001.xls |
11467000_stage_height_1998.xls |
| USGS-CA |
Guerneville Gage |
1/1/1998 |
12/31/2002 |
Q |
Guerneville_20021001.xls |
11467000_q98_02.xls |
| USGS-CA |
Guerneville Gage |
1/1/1999 |
12/31/1999 |
S |
Guerneville_20021001.xls |
11467000_stage_height_1999.xls |
| USGS-CA |
Guerneville Gage |
1/1/2000 |
12/31/2000 |
S |
Guerneville_20021001.xls |
11467000_stage_height_2000.xls |
| USGS-CA |
Guerneville Gage |
1/1/2001 |
12/31/2001 |
S |
Guerneville_20021001.xls |
11467000_stage_height_2001.xls |
| USGS-CA |
Guerneville Gage |
1/1/2002 |
12/31/2002 |
S |
Guerneville_20021001.xls |
11467000_stage_height_2002.xls |
| USGS-CA |
Guerneville Gage |
1/24/2002 |
9/30/2002 |
T |
Guerneville_20021001.xls |
11467000_temp_uv2.xls |
| USGS-CA |
Guerneville Gage |
10/1/2002 |
12/31/2002 |
T |
Guerneville_20021001.xls |
11467000_temp_uv.xls |
| USGS-CA |
Healdsburg Gage |
1/1/1998 |
7/7/1998 |
S |
Healdsburg_20020628.xls |
11463980_stage_height_1998.xls |
| USGS-CA |
Healdsburg Gage |
7/4/1998 |
1/11/2000 |
Q |
Healdsburg_20020628.xls |
11463980_discharge_mean_excel.xls |
| USGS-CA |
Healdsburg Gage |
5/4/1999 |
10/8/1999 |
S |
Healdsburg_20020628.xls |
11463980_stage_height_1999.xls |
| USGS-CA |
Healdsburg Gage |
4/5/2000 |
12/31/2000 |
S |
Healdsburg_20020628.xls |
11463980_stage_height_2000.xls |
| USGS-CA |
Healdsburg Gage |
5/24/2000 |
12/12/2002 |
Q |
Healdsburg_20020628.xls |
11463980_q98_02.xls |
| USGS-CA |
Healdsburg Gage |
1/1/2001 |
12/31/2001 |
S |
Healdsburg_20020628.xls |
11463980_stage_height_2001.xls |
| USGS-CA |
Healdsburg Gage |
1/1/2002 |
12/31/2002 |
S |
Healdsburg_20020628.xls |
11463980_stage_height_2002.xls |
| USGS-CA |
Healdsburg Gage |
6/23/2002 |
8/28/2002 |
T |
Healdsburg_20020628.xls |
11463980_temp_uv.xls |
| USGS-CA |
Healdsburg Gage |
8/29/2002 |
12/31/2002 |
T |
Healdsburg_20020628.xls |
11463980_temp_uv2.xls |
| USGS-CA |
Healdsburg Gage |
1/1/2002 |
12/12/2002 |
Q |
Healdsburg_20020628.xls |
11463980_discharge_mean.xls |
| USGS-CA |
Hopland Gage |
1/1/1998 |
12/31/1998 |
S |
Hopland_20011001.xls |
11462500_stage_height_1998.xls |
| USGS-CA |
Hopland Gage |
1/1/1998 |
12/31/2002 |
Q |
Hopland_20011001.xls |
11462500_q98_02.xls |
| USGS-CA |
Hopland Gage |
1/1/1999 |
12/31/1999 |
S |
Hopland_20011001.xls |
11462500_stage_height_1999.xls |
| USGS-CA |
Hopland Gage |
1/1/2000 |
12/31/2000 |
S |
Hopland_20011001.xls |
11462500_stage_height_2000.xls |
| USGS-CA |
Hopland Gage |
1/1/2001 |
12/31/2001 |
S |
Hopland_20011001.xls |
11462500_stage_height_2001.xls |
| USGS-CA |
Hopland Gage |
10/1/2001 |
10/16/2001 |
T |
Hopland_20011001.xls |
11462500_temp_uv.xls |
| USGS-CA |
Hopland Gage |
1/1/2002 |
12/31/2002 |
S |
Hopland_20011001.xls |
11462500_stage_height_2002.xls |
| USGS-CA |
Hopland Gage |
6/1/2002 |
7/12/2002 |
T |
Hopland_20011001.xls |
11462500_temp_uv2.xls |
| SOURCE KEY: |
DATA TYPES: |
|||||
| SCWA - ERP |
Sonoma County Water Agency -Engineering Resources Planning |
T |
Temperature Data |
|||
| SCWA - NR |
Sonoma County Water Agency - Natural Resources |
WL |
Water Level Elevations |
|||
| USGS - BRR, WR |
USGS -Branch of Regional Research, Western Region |
Q |
Discharge (or Pumping) Data |
|||
| USGS - CA |
USGS - California District |
S |
Stage Data |
|||
Temperature and water level elevation data presented in this chapter were collected for Sonoma County Water Agency Engineering Resource and Planning Division (SCWA-ERP) by PES Environmental Inc., Novato, CA. PES was contracted to undertake a hydrologic investigation at Steelhead Beach Regional Park, Westside Farms, Lazy W Ranch, Riverfront Regional Park, and the Town of Windsor/Hanson Aggregate property (fig. 1).
At each site various types of wells were constructed. Piezometers and staff gages were installed at all sites. At Westside Farms, Lazy W Ranch and Riverfront Regional Park, three piezometers (MP) were installed to depths of 1.22 m (4 ft), 2.44 m (8 ft), and 3.66m (12 ft) below the bottom of the riverbed. Each piezometer was constructed of 4.45 cm (1 3/4 inch) PVC casing with 30.5 cm (1 ft) long sections of 0.025 cm (0.010 inch) machine slotted well screen. At Lazy W ranch three additional piezometers were installed at depths of 4.72 m (15.5 ft), 6.1 m (20 ft), and 11.89 m (39 ft) with 60.96 cm (2 ft) long sections of 0.51 cm (0.020 inch) machine slotted well screen. The piezometers at Steelhead Beach Regional Park and the Town of Windsor/Hanson Aggregate property were constructed of 3.18 cm (1 ¼ inch) PVC casing with 12.7 cm (5 inch) long sections of 0.025 cm (0.010 inch) machine slotted well screen. Each set of piezometers consited of four piezometers that were installed at depths of 30.5 cm (1 ft), 91.44 cm (3 ft), 1.52 m (5 ft), and 2.44 m (8 ft). A piezometer cluster was installed at Steelhead Beach Regional Park to depths of 1.52 m (5ft) and 2.44 m (8 ft) below the bottom of the riverbed. The piezometers were constructed of 2.54 cm (1 inch) diameter galvanized steel pipe with approximately 12.7 cm (5 inch), long sections of slotted pipe.
Observation wells were installed at each site and constructed of 5.08 cm (2 inch) PVC with 0.051 cm machine slotted well screen. Test wells were installed at Westside Farms, Lazy W Ranch and Riverfront Regional Park. The test wells were constructed of 35.56 cm (14 inch) diameter low carbon steel casing with 12.2 m (40 ft) of 35.56 cm (14 inch) diameter stainless-steel wire wrapped well screen.
Measurements for temperature and water levels were made with the submersible electronic In-Situ Troll, mini Troll, Solinst LT leveloggers, and the In-Situ pressure transducers and temperature probes connected to data loggers. The Troll and mini-Troll are equipped with a Motorola HC11 processor, 16-bit resolution, 1 megabyte of memory and a real-time crystal clock. The Mini-Troll utilizes a silicon temperature sensor which measures within the range of -5°C to 50°C ±0.25°C. Thermal stabilization time is 30 min to 1hr to within 0.1% of full scale, and 1.5 to 2 hr to within 0.05% of full scale. In addition, a pressure sensor (with 21-meter long cable) converts pressure to depth of water above the sensor, using an integrated silicon strain-gauge pressure sensor, which has a range of 21 m (206.8 kPa, 30 psi) / ±0.1% over its full pressure range. Pressure measurements are automatically corrected for barometric pressure via the venting line included in the suspension line. Barometric equilibration time is 5 minutes to within 0.05% of full scale for 304.8 m (1000 ft) of cable. Upon installation, the Trolls are calibrated to its depth below the water surface and programmed for the desired sampling interval.
The LT Leveloggers have a temperature range from -10 oC to 40 oC + 0.1 oC over its full temperature range, and a pressure range equivalent to 4.0 + 0.02 m of water. Pressure (water level) measurements are corrected for barometric pressure by installing an additional logger outside the well or piezometer at each site to measure atmospheric pressure.
At Westside Farms, water level elevations in observation wells show the expected response to pumping: exponential decrease as the pumping test begins and recovery to previous levels when the test is complete. As water levels decrease in WS-OW-3 during the pumping test, water temperature steadily rises to a plateau midway through the test. This same correlation between rising temperature and decreasing water levels is observed in WS-MP-2. In addition, as water levels rise after the test is complete, temperatures drop back to pre-test conditions.
At Lazy W Ranch, water level elevations in observation wells decrease exponentially as the pumping test begins, with greatest drawdown observed in the nearest wells and less drawdown with increasing distance from the test well. Water elevations recover to previous levels when the test is complete. A small rise in temperature is associated with the end of the test in LW-OW-1. In the temperature records from the staff gage and LW-MP-2, the diurnal temperature oscillation is observed, with smaller amplitude in the deeper piezometer. These oscillations are disrupted slightly by the initiation of the pumping test, but appear unaffected by pumping after less than a day.
At Riverfront Regional Park, water level elevation and temperature at the Staff Gage (SG) show a diurnal signal (fig. 3 and table 2). Temperature data from KSG-MP-2 and KSG-MP-3 show a diurnal signal with the deeper KSG-MP-3 having greater amplitude and slightly lower temperatures. Finally, the temperature data from KSG-OW-1 does not exhibit a diurnal signal. Since KSG-OW-1 is much deeper than the shallow piezometers, the temperature signal does not observe the daily oscillations in water levels and temperature, but instead observes the longer term seasonal variations in temperature.
At the Town of Windsor/Hanson Aggregate property only the shallowest piezometers, Win-MP-1a-b, HA-MP-1a, and the staff gages, show a diurnal temperature signal. Temperature data from the observations wells, HA-OW-1 and HA-OW4 show a decrease in temperature with increasing depth. Water levels were influenced in HA-OW-3, HA-OW-4 and TW-MP-1d by the change in pumping rates of the Town of Windsor Municipal Supply wells.
At Steelhead Beach Regional Park Staff Gages and some of the shallowest piezometers show the diurnal temperature signal, while the deeper monitoring wells show a long-term seasonal temperature signal. Of particular interest in this study is that the water level gradient decreases with depth from Staff Gage SB-SG-1 to SB-PZ-1a to SB-PZ-1b to SB-PZ-1c.
Data files are named and organized according to site location and date of record. All records from a single site have been included in one data file.
Westside Farms:
| Test Wells |
T |
WL |
Observation Wells |
T |
WL |
Piezometers |
T |
WL |
Data Filename |
| WS-TW-1 Staff Gage |
x |
WS-OW-1 WS-OW-2 WS-OW-3 WS-OW-4 WS-OW-5 WS-OW-6 WS-OW-7 |
x |
WS-MP-1 WS-MP-2 WS-MP-3 |
x |
||||
| x |
x |
x |
|||||||
| x |
x |
x |
|||||||
| x |
|||||||||
| WS-SG |
x |
x |
x |
||||||
| x |
|||||||||
| x |
x |
||||||||
Lazy W Ranch:
| Test Wells |
T |
WL |
Observation Wells |
T |
WL |
Piezometers |
T |
WL |
Data Filename |
| LW-TW-1 Staff Gage |
x |
LW-OW-1 LW-OW-2 LW-OW-3 |
x |
x |
LW-MP-1 LW-MP-2 LW-MP-3 LW-MP-4 LW-MP-5 LW-MP-6 |
x |
|||
| x |
x |
x |
|||||||
| x |
x |
||||||||
| x |
|||||||||
| LW-SG |
x |
x |
x |
||||||
| x |
x |
||||||||
Riverfront Regional Park:
| Test Wells |
T |
WL |
Observation Wells |
T |
WL |
Piezometers |
T |
WL |
Data Filename |
| KSG-TW-1 Staff Gage |
x |
KSG-OW-1 KSG-OW-2 KSG-OW-3 KSG-OW-4 KSG-OW-5 KSG-OW-6 KSG-OW-7 |
x |
x |
KSG-MP-1 KSG-MP-2 KSG-MP-3 |
x |
|||
| x |
x |
x |
|||||||
| x |
x |
x |
|||||||
| x |
|||||||||
| KSG-SG |
x |
x |
x |
||||||
| x |
|||||||||
| x |
Town of Windsor:
| Test Wells |
T |
WL |
Observation Wells |
T |
WL |
Piezometers |
T |
WL |
Data Filename |
| Staff Gage |
WIN-MP-1a WIN-MP-1b WIN-MP-1c WIN-MP-1d WIN-MP-2a WIN-MP-2b WIN-MP-2c WIN-MP-2d |
x |
x |
||||||
| x |
x |
||||||||
| x |
x |
||||||||
| x |
x |
||||||||
| WIN-SG-1 WIN-SG-2 |
x |
x |
x |
x |
|||||
| x |
x |
x |
x |
||||||
| x |
x |
||||||||
| x |
x |
||||||||
Hanson Aggregate
| Test Wells |
T |
WL |
Observation Wells |
T |
WL |
Piezometers |
T |
WL |
Data Filename |
| Staff Gage |
HA-OW-1A HA-OW-1B HA-OW-1C HA-OW-2 HA-OW-3 HA-OW-4A HA-OW-4B HA-OW-4C |
x |
x |
HA-MP-1A HA-MP-1B HA-MP-1C HA-MP-1D HA-MP-2A HA-MP-2B HA-MP-2C HA-MP-2D |
x |
x |
|||
| x |
x |
x |
x |
||||||
| x |
x |
x |
x |
||||||
| x |
x |
x |
x |
||||||
| HA-SG-1 HA-SG-2 |
x |
x |
x |
x |
x |
x |
|||
| x |
x |
x |
x |
x |
x |
||||
| x |
x |
x |
x |
||||||
| x |
x |
x |
x |
||||||
Steelhead Beach Regional Park:
| Test Wells |
T |
WL |
Observation Wells |
T |
WL |
Piezometers |
T |
WL |
Data Filename |
| Staff Gage |
SB-OW-1a SB-OW-1b SB-OW-1c SB-OW-2a SB-OW-2b |
x |
x |
SB-PZ-01a SB-PZ-01b SB-PZ-01c SB-PZ-01d SB-PZ-02a SB-PZ-02b SB-PZ-02c SB-PZ-02d |
x |
x |
|||
| x |
x |
x |
x |
||||||
| x |
x |
x |
x |
||||||
| x |
x |
x |
x |
||||||
| SB-SG-1 SB-SG-2 |
x |
x |
x |
x |
x |
x |
|||
| x |
x |
x |
x |
||||||
| x |
x |
||||||||
| x |
x |
||||||||
 |
| Figure 3. Sample stream thermograph (temperature over time) and stage hydrograph (referenced water depth over time) from Riverfront Regional Park Staff Gage |
Table 2. Sample table from data collected under the direction
of SCWA-ERP

The Engineering Resource and Planning Division of Sonoma County Water Agency continued monitoring water level elevation and temperature in wells installed in 1998. Data in this section are typically of much longer duration and were collected in order to evaluate seasonal trends in test and observation wells at Riverfront Regional Park, and Wohler Bridge area (fig. 1).
Existing wells were used at Riverfront Regional Park and Wohler Bridge area. Temperature measurements were made with Trolls and mini-Trolls.
Below Wohler Bridge, SCWA operates an inflatable dam during peak water supply demand months to increase river stage approximately 3 m and passively recharge the alluvial aquifer (fig. 4, 5). This backwater area produces higher temperatures and lower velocities in the river that extend for approximately 2 miles. The streambed of the river at the dam is approximately 10 m, msl (mean seal level). The middle of the screened interval of the Wohler area observation wells is generally in the vicinity of 0 m, msl.
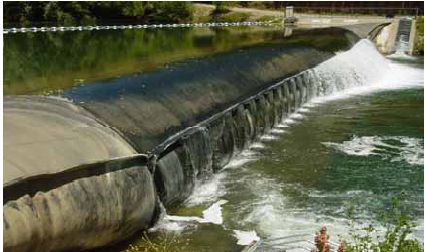 |
| Figure 4. The inflatable dam is constructed of ‘automotive-tire’ type rubber and is inflated with water. The fish ladders may be seen on either bank downstream of the dam. |
 |
| Figure 5. Stream stage above the inflatable Dam shown in figure 4. |
At Wohler Bridge area, data were collected during 2000 to 2002. With the exception of TW-8, which maintains a constant temperature throughout the year, all monitoring wells show a broad, long-term temperature response to changing seasonal temperatures. The maximum temperatures in the wells occur in September to October, and minimum temperatures occur in April. MW-93-14 shows a pronounced increase in water level elevation and decrease in temperature when the inflatable dam was lowered in January 2001.
At Riverfront Regional Park a single, long-term data set collected in 2002 at KSG-OW-1 show greater variability in both temperature and water level elevation early in the summer, a gradual decrease throughout the summer, and a single pronounced spike in early November (fig. 5, table 3). One monitoring well at Lazy W Ranch (LW-04) was monitored in 2002, and shows similar behavior.
Data files are named and organized according to site location and date of record. All records from a single site during a single calendar year have been included in one data file.
Riverfront Regional Park:
| Test Wells |
T |
WL |
Observation Wells |
T |
WL |
Piezometers |
T |
WL |
Data Filename |
| KSG-OW-1 |
x |
x |
|||||||
| LW-OW-4 |
X |
X |
Wohler Bridge:
| Test Wells |
T |
WL |
Observation Wells |
T |
WL |
Piezometers |
T |
WL |
Data Filenames |
| TW-1 TW-8 TW-13 |
x |
x |
MW-93-14 MW-93-18 |
x |
x |
||||
| x |
x |
x |
x |
||||||
| x |
x |
||||||||
 |
| Figure 6. Sample stream thermograph and stage hydrograph for KSG-OW-1 |
Table 3. Sample table from data collected by SCWA-ERP

Data presented in this section are temperature data collected by the Natural Resource Division of the Sonoma County Water Agency (SCWA-NR) at Russian River observation sites between the confluence of the Russian River with Dry Creek and Steelhead Beach Regional Park with Syar being the most upstream site. SCWA-NR began monitoring temperature in the Russian River in order to quantify conditions for fish habitat. Temperature changes associated with water released from dams (often cold) and low flow conditions during the summer months (often warm) are of concern for Russian River fish habitat.
Most temperature data were collected using Onset HOBO data loggers. The HOBO logger is a single channel 8-bit data logger that is submersible. The loggers have a temperature range of -20°C to 70°C ±0.7°C at 21°C.
Additional monitoring at the fish screens near the inflatable dam was conducted using a YSI 6820 multi-parameter probe. The YSI 6820 is a self-contained, submersible instrument. The temperature sensor measures a range of temperature from -5 to +45°C with a resolution of 0.01°C and accuracy ±0.15°C, and the pressure sensor has a range equal to 0 to 61 m, with a resolution of 0.001 m and accuracy of ±0.12 m.
Temperature records in the middle to lower Russian River area show a dampened diurnal temperature signal (fig.7, table 4) as compared to other sites in this report. One reason for this dampened signal is that many of these monitoring stations are upstream of the inflatable dam.
Data files from this chapter are have been named and organized according to date of record. While the data files are named “Wohler” and “Mirabel,” they are not limited to those particular areas but rather contain data from a number of monitoring points (listed specifically below) near the area above and below the inflatable dam.
Russian River near Wohler Bridge and Mirabel Dam:
| Site No. |
Location |
Depth(s) |
Description |
T |
WL |
Data Filename |
|
| surface |
bottom |
||||||
| 3 4 5 |
x |
x |
1 meter 3.66 meters 0.46 meters |
Glide above Redwood Hole Levee Rock Wall (Rip Rap) Mirabel Dam |
x |
||
| x |
x |
x |
|||||
| x |
x |
x |
|||||
Russian River near Wohler Bridge and Mirabel Dam:
| Site No. |
Location |
Depth(s) |
Description |
T |
WL |
Data Filename |
|
| surface |
bottom |
||||||
| 3 5 7 |
x |
x |
0.5, 4.0 meters |
Redwood Hole Mirabel Dam Steelhead Beach |
x |
||
| x |
x |
x |
|||||
| x |
x |
x |
|||||
Russian River near Wohler Bridge and Mirabel Dam:
| Site No. |
Location |
Depth(s) |
Description |
T |
WL |
Data Filename |
|
| surface |
bottom |
||||||
| 1 2 3 4 5 6 7 |
x |
x |
0.5, 4.0 meters |
Syar Benoist Redwood Hole Levee Rock Wall (Rip Rap) Mirabel Dam Below Mirabel Dam Steelhead Beach |
x |
||
| x |
x |
x |
|||||
| x |
x |
x |
|||||
| x |
x |
x |
|||||
| x |
x |
x |
|||||
| x |
x |
||||||
| x |
x |
x |
|||||
Russian River near Wohler Bridge and Mirabel Dam:
| Site No. |
Location |
Depth(s) |
Description |
T |
WL |
Data Filename |
|
| surface |
bottom |
||||||
| 1 2 3 4 5 6 7 8 |
x |
x |
0.5, 4.0 meters |
Syar Benoist Redwood Hole Levee Rock Wall (Rip Rap) Mirabel Dam Below Mirabel Dam Steelhead Beach (not named) |
x |
||
| x |
x |
x |
|||||
| x |
x |
x |
|||||
| x |
x |
x |
|||||
| x |
x |
x |
|||||
| x |
|||||||
| x |
x |
x |
|||||
| x |
x |
||||||
Mirabel Inflatable Dam:
| Description |
T |
Depth |
Data Filename |
| YSI sonde at Fish Screens |
x |
x |
|
 |
| Figure 7. Sample thermograph for surface water sites near Wohler Bridge and Inflatable Dam |
Table 4. Sample table from data collected by SCWA-NR
Data presented in this section include temperature data collected by the United States Geologic Survey's Branch of Regional Research, Western Region (USGS, BRR, WR) from Riverfront Regional Park, Wohler Bridge, and Steelhead Beach Regional Park (fig. 1). USGS, BRR, WR conducted individual studies at several sites along the Russian River designed to assess the hydraulic conductivity of the geologic materials in the riverbed.
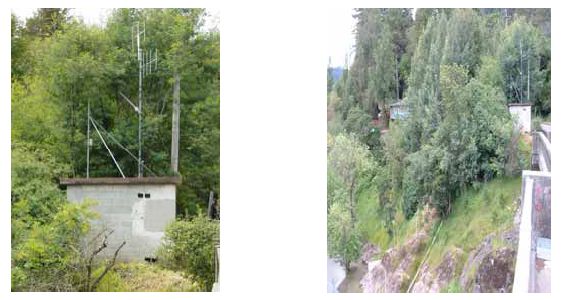
Shallow piezometers were installed in riverbed sediments seasonally with the aid of Sonoma County Water Agency personnel using a hand-held casing hammer. Temperature data were collected by the Onset Optic Stowaway data loggers that were hung inside each piezometer at desired depths (fig. 8). An additional logger was tied to the outside of a piezometer to measure river temperature. Water level elevations were measured a few times by hand.
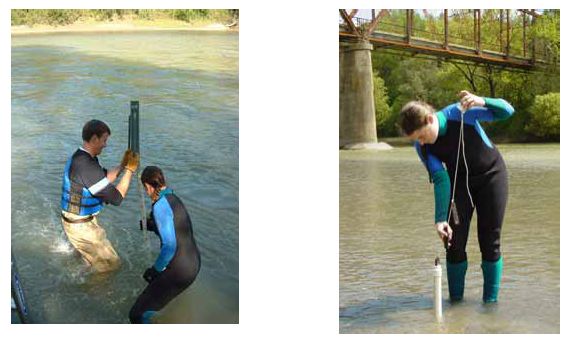 |
| Figure 8. Installation of a piezometer 1 to 2 m into the streambed and placement of temperature loggers into a nearby piezometer |
At Steelhead Beach Regional Park three piezometers monitored in 2000 from September 22 to 28 show the expected diurnal signal in the shallowest piezometer, SB-PZ-01a, and a dampened diurnal signal coupled with increased overall temperature with increasing depth to SB-PZ-01c, where only a long-term seasonal temperature signal is observed. In 2001, from September 26 to October 10, three data loggers were hung at different depths in each piezometers with total depths of 1.22 and 2.44 m (4 and 8 ft). Both piezometers were submerged on October 4, and all loggers measured the stream temperature after that date.
At Wohler Bridge in 2001 during the period of record, mean temperature decreases by ~10°C, and the amplitude of the stream, 0.3 and 0.61 m (1-ft and 2-ft) deep signals decrease by almost half (fig. 9, table 5). These records show the diurnal temperature variation, the long seasonal trend, and weekly to bi-weekly variations.
At Riverfront Regional Park the early data show a clear diurnal signal, with markedly smaller amplitude at 0.3 and 0.61 m (1 ft and 2 ft) depths than observed at the Wohler site over the same time period. The period of record at Riverfront Regional Park is shorter in duration due to vandalism and submergence of the piezometers.
Data files are named and organized according to site location and date of record. Many of these temporary piezometers installed for studies reported in this section were not given formal names, and are referred to here by the approximate depth below streambed sediments of the midpoint of their screened interval. Where multiple temperature sensors were suspended in a single piezometer, the approximate depth of the sensor is listed below.
Steelhead Beach Regional Park:
| Piezometers |
Approximate Screen Depth |
T |
WL |
Data Filename |
| Piezometer-1a Piezometer-1b Piezometer-1c |
0.75 meters 2.75 meters 4.75 meters |
x |
||
| x |
||||
| x |
||||
Steelhead Beach Regional Park:
| Piezometers (named by approximate screen depth) |
Approximate Sensor Depth |
T |
WL |
Data Filename |
| 1.22m piezometer 1.22m piezometer 1.22m piezometer 2.44m piezometer 2.44m piezometer 2.44m piezometer |
(Surface Water) 0.30 meters 0.61 meters 1.22 meters (Surface Water) 0.61 meters 1.22 meters 2.44 meters |
x |
||
| x |
||||
| x |
||||
| x |
||||
| x |
||||
| x |
||||
| x |
||||
| x |
||||
Wohler:
| Piezometers (named by approximate screen depth) |
T |
WL |
Data Filename |
||
| (Surface Water) 0.30m piezometer 0.61m piezometer |
x |
||||
| x |
|||||
| x |
|||||
Riverfront Regional Park:
| Piezometers (named by approximate screen depth) |
T |
WL |
Data Filename |
|
| (Surface Water) 0.30m piezometer 0.61m piezometer 1.84m piezometer |
x |
|||
| x |
||||
| x |
||||
| x |
||||
 |
| Figure 9. Sample set of 3 thermographs created from temperature measurements in Wohler Shallow Piezometers |
Table 5. Sample table from data collected by USGS- BRR, WR
Data presented in this section are stage (water level elevation relative to gage-specific datum), mean daily discharge and temperature data from three established USGS gaging stations along the Russian River by the United States Geologic Survey's California District (USGS-CA). The three gaging stations are 11462500, Russian River near Hopland, 11463980, Russian River near Digger Bend (near Healdsburg), and 11467000, Russian River near Guerneville (fig. 10).
Stage and discharge measurements are made according to USGS protocol (Buchanan and Somers, 1969). Temperature measurements are made with a YSI 6820 multi-parameter Sonde following the protocol outlined by Radtke and others, 1998.
The Russian River hydrographs show trends typical for most north coast rivers in California: the highest discharges are recorded from November to March, when most of the precipitation falls in the region; occasional late storms in April or May produce significant discharges of shorter duration, and the gradual exponential decay from stormflow highs back to baseflow occurs during late spring and summer, reaching the lowest discharges late in summer and early fall (fig. 11, table 6). There is no significant snowmelt influence on discharge in the Russian River basin, so winter (dominantly rain) precipitation forms the bulk of runoff measured. As expected, river temperatures at all three sites show a seasonal decrease from summer to winter in both mean temperature and amplitude of daily change. Temperatures are lowest in the winter months (also concurrent with the highest discharges), and increase in mean and amplitude of daily change from winter to summer. The highest temperatures in the Russian River are not always recorded during the hottest months of the year, but rather when there is the least water flowing in the river.
Data files are named and organized according to site location and date of record. All records from a single site have been included in one data file.
United States Geologic Survey Gaging Stations:
| USGS Gage No. |
Description |
T |
S |
Q |
Data Filename |
| 11463980 11462500 11467000 |
RUSSIAN R NR HOPLAND CA RUSSIAN R A DIGGER BEND NR HEALDSBURG CA RUSSIAN R NR GUERNEVILLE CA |
x |
x |
x |
|
| x |
x |
x |
|||
| x |
x |
x |
|||
 |
| Figure 11. River stage, discharge (streamflow), and thermograph from USGS Gage 11467000 |
Table 6. Sample table from data collected by USGS,
CA District
Buchanan, T.J., and Somers, W.P., 1969, Discharge measurements at gaging stations: U.S. Geological Survey Techniques of Water-Resources Investigations, book 3, chap. A8, 65p.
Constantz, J., Stewart, A.E., Niswonger, R., and Sarma, L., 2002, Analysis of temperature profiles for investigating stream losses beneath ephemeral channels: Water Resources Research, v. 38, no. 12, p. 52-1 to 52-13. (on-line abstract)
Constantz, J., 1998. Interaction between stream temperature, streamflow, and groundwater exchanges in alpine streams: Water Resources Research, v. 34, no. 7, p. 1609-1615.
Radtke, D.B., Kurklin, J.K., and Wilde, F.D., 1998, Field measurement of temperature, in National field manual for the collection of water-quality data: U.S. Geological Survey Techniques of Water-Resources Investigations, book 9, chap. A6, p. T1-T5.
Stonestrom, D.A., and Constantz, J., 2003, Heat as a tool for studying the movement of ground water near streams, U.S. Geological Survey Circlular1260, 96 p.
This report is available online in Portable Document Format (PDF). If you do not have the Adobe Acrobat PDF Reader, it is available for free download from Adobe Systems Incorporated.
Download the report (PDF, 1.5 MB)
Document Accessibility: Adobe Systems Incorporated has information about PDFs and the visually impaired. This information provides tools to help make PDF files accessible. These tools convert Adobe PDF documents into HTML or ASCII text, which then can be read by a number of common screen-reading programs that synthesize text as audible speech. In addition, an accessible version of Acrobat Reader 5.0 for Windows (English only), which contains support for screen readers, is available. These tools and the accessible reader may be obtained free from Adobe at Adobe Access.
For more information about USGS activities in California, visit the USGS California District home page.
| AccessibilityFOIAPrivacyPolicies and Notices | |
 |
|