 |
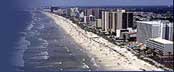
Figure 1. Regional map display. Inset map of South Carolina and blow up images of the South Carolina portions of both Phase I and Phase II study areas for the South Carolina/Georgia Coastal Erosion Study. Islands, beaches and major water bodies are labeled. Detailed location map from Figure 2 is outlined in red within the Phase II study area (modified from Baldwin, 2002). [larger version] |
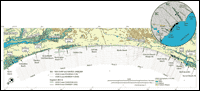 |
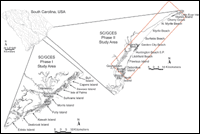
Figure 2. Map showing location of study area. Geophysical tracklines are color coded based on survey year and sub-bottom data type. Also depicted are local municipalities, landmarks, water bodies and rivers. Inset provides regional orientation, including identification of influential structural arches (Cape Fear Arch (CFA), Mid-Carolina Platform High (MCPH)) and embayments, capes and water bodies. Piedmont draining rivers are displayed in red (inset). Inland Cretaceous/Tertiary contact in orange approximated from Owens (1990). [larger version] |
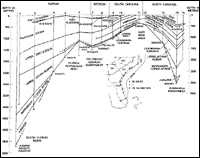 |
Figure 3. Generalized stratigraphic cross-section along the modern coast line from Florida to North Carolina. Adapted from Plate 9 of Maher and Applin (1971) using data in Applin and Applin (1965), Brown and others (1972), Gohn and Others (1977), Valentine (1979), and Applegate and others (1981). The names of the numbered wells are: 1. Bass Enter-Pumpkin Bay; 2. Humble-Collier #1; 3. Humble-Tucson #1; 4. Humble-Carroll #1; 5. Sun Oil-Powell Land #1; 6. Humble-Foremost #1; 7. California-Buie #1; 8. Larue-Jelks and Rodgers #1; 9. U.S.-Parris Island #2; 10. USGS-Clubhouse Crossroads #1; 11. USGS-Brittons Neck #1; 12. USGS-Calabash #1; 13. Karston-Laughton #1; 14. Standard Oil-Hatteras Light #1; a5. Stanard Oil - Esso #2 (from Gohn, 1988). [larger version] |
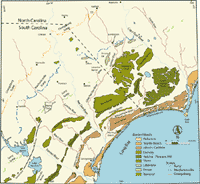 |
Figure 4. Geomorphological map of southeastern North Carolina and northeastern South Carolina (modified from DuBar and others, 1974). Pleistocene and Holocene barrier systems are shown. The sections of these terraces dissected by Piedmont (blue color) and Coastal Plain (brown color) rivers on their way to the coast are also illustrated. [larger version] |
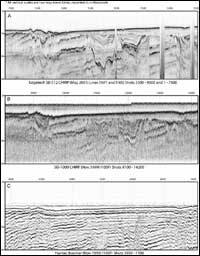 |
Figure 5. Profiles generated by three seismic reflection systems utilized within this study. [larger version] |
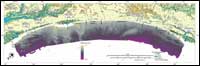 |
Figure 6. Submetrix Interferometric Sonar Bathymetry (234 kHz) coverage of the study area. Inter-line interpolation was required to generate a continuous bathymetric surface from ~ 70 - 100 m swath widths. [larger version] |
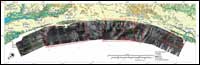 |
Figure 7. SIS-1000 100 kHz sidescan-sonar image of the study area. Light tones depict areas of high backscatter and dark tones indicate areas of low backscatter. Inset numbered boxes indicate the locations of figures within the text. Green lines indicate trackline coverage of sub-bottom profiles and green circled white crosses indicate groundtruth locations used for illustration. [larger version] |
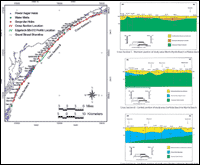 |
Figure 8. Three shore-parallel cross sections, generated by Putney and others (2002), incorporating drilling data from Geoprobe, water wells and power auger. Location figure (left) shows position for each of the sections. Boring data from the beach transects indicate approximately 10 - 30 m of Quaternary (Holocene and Pleistocene) sediment overlying older Cretaceous and Tertiary continental shelf deposits. The boundary between underlying Cretaceous/Tertiary units is identified within the central and southern cross sections, and is shown to shallow significantly in the Surfside Beach area, between Geoprobe holes Hor-1 and Hor-3. The position of the nearshore Edgetech SB-512 CHIRP sub-bottom profile A - A' (Figure 9) is also indicated on the location figure (left) (modified from Putney and others, 2002). [larger version] |
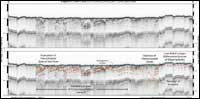 |
Figure 9. Composite CHIRP sub-bottom profile, with interpretations, from the nearshore area along Surfside Beach where the contact between underlying Cretaceous and Tertiary units has been identified inland. The profile identifies several strong reflections within the underlying continental shelf strata, but does not provide sufficient information for the positive identification of a single reflection representative of the unconformable boundary. Vertical scales for sub-bottom profiles are provided in both milliseconds (Two-Way Travel Time) and approximate depth in meters (assuming a seismic velocity of 1500 m/s). The location for profile A - A' is outlined in Figure 7 and on the inset map in Figure 8. [larger version] |
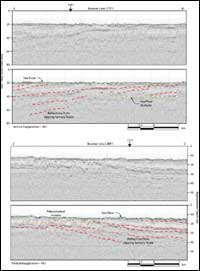 |
Figure 10. Processed boomer sub-bottom profiles with interpretations. These profiles provide both shore parallel (L77F1) and shore perpendicular (L89F1) images of the subsurface. These images illustrate the slight southerly dip of the Tertiary continental shelf strata underlying the area (Deeper Cretaceous strata are likely not imaged). Vertical scales for sub-bottom profiles are provided in both milliseconds (Two-Way Travel Time) and approximate depth in meters (assuming a seismic velocity of 1500 m/s). Locations for lines L77F1 and L89F1 are outlined in Figure 7. [larger version] |
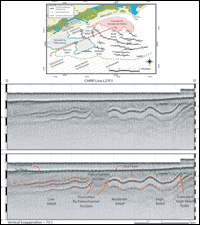 |
Figure 11. Generalized structure map (top, location outlined in Figure 7) of the nearshore portion of the study area from Cherry Grove to Little River Inlet, which illustrates the folded nature of underlying Cretaceous beds. Folding of this nature is observed throughout the study area, but is particularly prevalent at this location. Below, the CHIRP sub-bottom profile with interpretations (D - D', transect located on inset structure map) shows examples of the varying degrees of relief associated with the folded strata. Also illustrated are examples of folded strata being truncated by the transgressive unconformity, and by paleochannel incision. The high relief antiform structure in the central portion of the profile has been breached at its crest by a paleochannel incision. Thinning and fracturing of the strata at the crest of antiform structures could increase the likelihood of fluvial incision at that location. Vertical scales for sub-bottom profiles are provided in both milliseconds (Two-Way Travel Time) and approximate depth in meters (assuming a seismic velocity of 1500 m/s). [larger version] |
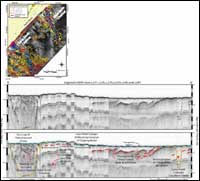 |
Figure 12. Sidescan-sonar coverage overlain by thickness of channel fill (top left, location outlined in Figure 7), showing the location and trends of the Cane North and Cane South channels. The composite CHIRP sub-bottom profile with interpretations (E - E') provides subsurface imagery of the two channel features along a nearshore transect (top left). The seismic example illustrates how cross-sectional morphology (including width and incision depth) and cross shelf morphologies of paleochannel incisions vary within the study area. Vertical scales for sub-bottom profiles are provided in both milliseconds (Two-Way Travel Time) and approximate depth in meters (assuming a seismic velocity of 1500 m/s). [larger version] |
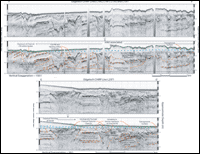 |
Figure 13. CHIRP sub-bottom profiles with interpretations from offshore Murrells Inlet. The two profiles provide subsurface imagery in shore parallel (Top, F - F') and shore perpendicular (Bottom, G - G') transects (located in figures 7 and 15). Both profiles illustrate the incised valley feature and overlying shoal complex associated with Murrells Inlet. Channels comprising the incised valley demonstrate the variability in cross sectional morphology and complex fill geometries that are observed in type I channel features (F - F' and G - G'). Examples of the geologically younger type II channel features are also illustrated (G - G'). Vertical scales for sub-bottom profiles are provided in both milliseconds (Two-Way Travel Time) and approximate depth in meters (assuming a seismic velocity of 1500 m/s). [larger version] |
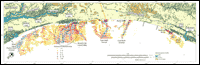 |
Figure 14. Map showing the locations and thickness of fill associated with paleochannels identified within the seismic reflection data. Indications of paleochannel incision have been interpreted as concave up erosional unconformities that truncate strata of increasing age. Values are presented as approximate depths in meters (assuming a seismic velocity of 1500 m/s). In most cases, these incisions dissect underlying tilted strata of Cretaceous/Tertiary age. [larger version] |
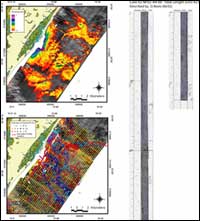 |
Figure 15. Sidescan-sonar coverage overlain by surficial sediment thickness grid (upper left, location outlined in Figure 7), showing the distribution of surficial sediment within the inner continental shelf offshore of Murrells Inlet. Sediment within the shoals is thickest (4 - 6 m) near the mouth of the inlet, and generally thins seaward. In several offshore locations however, localized accumulations exceed 3 m. Vibracore sample NF02-A4-60 (right, location upper left and in Figure 7) illustrates the type of sediment within the shoals, which is predominantly medium to fine grained sands containing ~ 10 % shell fragments. An ~ 1.5 m discrepancy in sediment thickness is indicated between the core sample and the thickness grid at this location. This may be due to sediment moving into the area between the times of acquisition (from '99 - '00 to '02), or inadequate resolution within the SIS-1000 sub-bottom data. Sidescan-sonar coverage overlain by thickness of channel fill (lower left, location outlined in Figure 7) illustrates the Murrells Inlet incised valley that underlies the inlet associated shoal complex. Channel incisions within this incised valley comprise a complex integrated drainage network with multiple thalweg features. Seismic profiles F - F' and G - G', depicted in Figure 13 (outlined lower left, and in Figure 7), provide vertical cross sections of these sub-surface features. (Vibracore images and descriptions provided by Coastal Carolina University, Gayes 2002, pers. comm.) [larger version] |
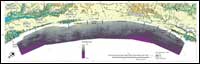 |
Figure 16. Elevation of regionally defined transgressive surface as mapped from CHIRP sub-bottom profiles. [larger version] |
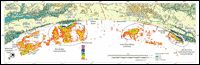 |
Figure 17. Map showing the thickness of modern surficial sediment accumulation. Measurements of surficial sediment lenses within CHIRP seismic data were used to generate this isopach grid. Thickness values are presented in meters (assuming a seismic velocity of 1500 m/s.) White areas indicate surficial sediment measurements of less than 0.5 m. [larger version] |
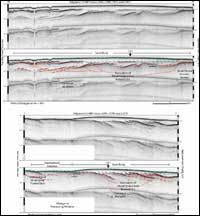 |
Figure 18. Composite CHIRP sub-bottom profiles with interpretations, from the large shore oblique sand feature offshore of the Myrtle Beach area. These profiles provide sub-bottom images of the feature along its long axis (left) and in a shore perpendicular transect across its thickest short axis (right). They illustrate the transparent nature of the seismic signature generated by surficial sediment lenses, as well as the underlying transgressive surface (T.S.). Vertical scales for sub-bottom profiles are provided in both milliseconds (Two-Way Travel Time) and approximate depth in meters (assuming a seismic velocity of 1500 m/s). Locations for lines H - H' (L58F4, L58F3, L58F2 and L58F1) and I - I' (L57F3, L57F4 and L57F5) are outlined in Figures 7 and 19. [larger version] |
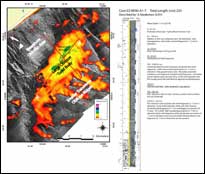 |
Figure 19. Side-Scan Sonar coverage (left, location outlined in Figure 7) overlain by surficial sediment accumulation grid, showing the orientation and sediment thickness associated with the large shore oblique sand body that trends in a NE - SW direction across the inner continental shelf offshore of Myrtle Beach. The feature is ~ 11 km long along its axis, and ~ 3 km at its widest point. In some areas, sediment accumulation within the feature is in excess of 3 m. Vibracore sample NF00-A1-7 (right, location above and in Figure 7) illustrates the sediment type within the feature, as well as the transgressive surface beneath. The feature is considered anomalous, because it is one of the only significant accumulations of surficial sediment that is non-inlet related, and lies north of the inferred Cretaceous/Tertiary boundary. Seismic profiles H - H' and I - I', depicted in Figure 18 (outlined at left, and in Figure 7), provide vertical cross sections of the sub-surface in this area. [larger version] |
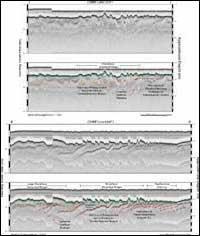 |
Figure 20. CHIRP sub-bottom profiles with interpretations from the shoreface-attached and shoreface-detached ridges offshore Pawleys Island. These profiles provide sub-bottom images of the features, illustrating their cross sectional profiles. The images also illustrate how the strata underlying the features crop out in the swales between them. Vertical scales for sub-bottom profiles are provided in both milliseconds (Two-Way Travel Time) and approximate depth in meters (assuming a seismic velocity of 1500 m/s). Locations for profiles J - J' and K - K' are outlined in Figure 7. [larger version] |