|
|
|
|
|
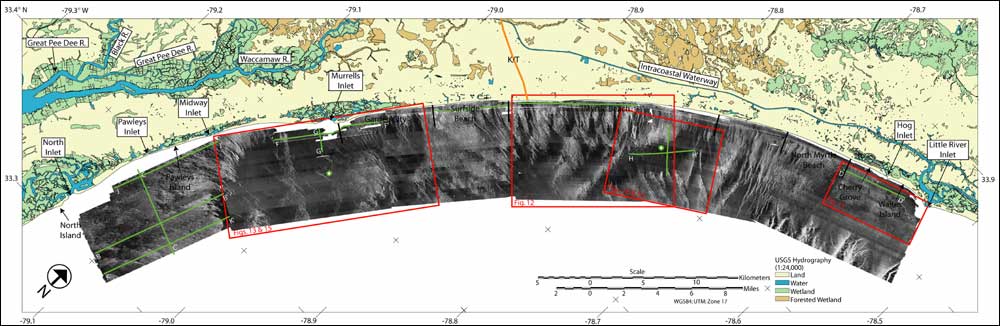
Figure 7. SIS-1000 100 kHz sidescan-sonar image of the study area. Light tones depict areas of high backscatter and dark tones indicate areas of low backscatter. Inset numbered boxes indicate the locations of figures within the text. Green lines indicate trackline coverage of sub-bottom profiles and green circled white crosses indicate groundtruth locations used for illustration.
|
Can't see the printable PDF version? Get the free Adobe Acrobat® Reader. |