|
|
|
|
|
|
|
Geophysical Data - Processing & Interpretation
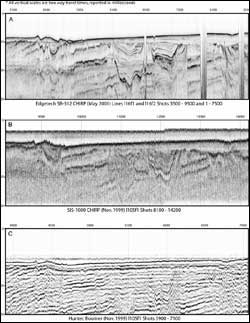
Sidescan-sonar data were processed using USGS software packages Xsonar and ShowImage, following the methodology of Danforth and others (1991) and Paskevich (1992). Geomatica TM Software Solutions was used to mosaic the processed sidescan-sonar data. These data were mapped at a 4 m / pixel resolution, and exported in raw binary format. The data were then imported to Adobe Photoshop and a linear stretch was applied to enhance the contrast between low- and high-backscatter. Data were saved in the geoTIFF image format. The Boomer and SIS-1000 CHIRP SEG-Y data were processed using the Colorado School of Mines Seismic Unix (SU) processing package (Cohen and Stockwell, 2001). Band pass filter (Boomer only (0-300-2500-3000 Hz)) and automatic gain control (AGC) were applied. SB-512 CHIRP SEG-Y data were processed using SIOSEIS and SU processing packages. Heave correction (compensating for roughness of the sea surface) and AGC were applied. All processed profiles were archived and converted from post-script format to j-peg or gif image formats. Figure 5 compares the resolution of the three seismic reflection systems utilized within the study. Each system provides sub-surface imagery at a different vertical resolution, and was utilized to meet varied research objectives. The Edgetech SB-512 system (Figure 5a) provides the highest resolution (0.5 - 1 m depending upon substrate) and was used during the nearshore surveys (COAS01008 and COAS02011), providing detailed imagery of the inner continental shelf and shoreface. During the USGS cruises ATSV99044 and MGNM00014, the Datasonics SIS-1000 and Huntec boomer systems (Figures 5b and 5c respectively) were operated concurrently. The SIS-1000 system provided high-resolution imagery (~ 1 m) of the shallow sub-surface. The boomer system provides a lower vertical resolution (> 1 m), but is capable of deeper penetration, yielding information concerning deeper strata. Navigation and SEG-Y traces were imported and interpreted digitally in Landmark Graphics Corporation Inc. Seisworks seismic interpretation software package. Reflections representing the seafloor, marine transgressive surface, and paleochannel incisions were digitized, providing two-way travel time horizons. By subtracting the seafloor from the deeper horizons, isochron surfaces indicating surficial sediment thickness and depth of paleochannel incision were generated. Using a constant seismic velocity of 1500 m/s, Two-way travel time horizons and isochron surfaces were converted to approximate depth horizons and isopach surfaces, and exported from Seisworks as georeferenced point files. ESRI ArcINFO 8.0.2 Geographic Information System (GIS) software was utilized to produce interpolated grid surfaces of horizons and isopachs from the mass point data. All grids were generated with a cell size of 10 m. ESRI ARCVIEW 3.2 and ERDAS IMAGINE 8.5 GIS software were used to generate structure and isopach maps. Products were exported to Adobe Illustrator for figure drafting and editing, and Adobe Acrobat for display.
|