|
|
|
|
|
|
|
Seismic Stratigraphy
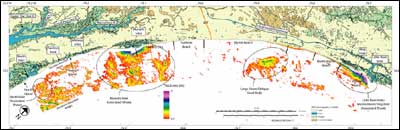
Thickness and Distribution of Modern SedimentSedimentary deposits overlying the regional transgressive unconformity are referred to as modern sediment (Pleistocene and younger). These deposits are acoustically transparent, indicative of homogeneous sediment. Vibracores and bottom grab samples show these deposits to be composed primarily of medium- to fine-grained, well-sorted sand. Figure 17 contains an isopach map of modern sediment accumulation. The thickest deposits occur south of the inferred contact between Cretaceous and Tertiary strata and north of the Myrtle Beach area (Figure 2). Sediment cover is thin to absent in much of the north-central portion of the study area. This region is not completely devoid of sediment, but most of the deposits are too thin to be resolved by the sub-bottom systems utilized here. Sidescan-sonar imagery, grab samples and vibracores indicate that surficial sediment deposits less than one meter thick are common throughout the study area. Imagery from offshore of Myrtle Beach illustrates this situation (Figures 7 and 12), where linear low-backscatter areas extending from the shoreface in the sonar image are not resolvable as sediment accumulations within coincident sub-bottom profiles.
Nearly every zone of significant sediment accumulation shown on Figure 17 appears to be related to tidal inlets, welded barrier islands or shoreface-attached and shoreface-detached ridges. One anomaly is a large, shore-oblique, northwest-southeast trending sand body (Figure 18), which shows up as a large low-backscatter area in the sidescan-sonar image offshore of Myrtle Beach (Figures 7 and 19). This deposit measures ~ 11 km along its axis and ~ 3 km at it widest point (Figure 19). Sediment comprising the feature is thickest (~ 3 m) near its center. Smaller, ridge-like features, traverse the sand body in an east-west direction. The large sand body and the smaller transverse ridges are composed predominantly of medium-grained quartz sands (Figure 19). At this time the sediment source and generating mechanism for these features are unknown.
A narrow shoal complex abutting the shoreface between Cherry Grove and Little River Inlet comprises a second significant sediment accumulation north of the inferred contact between Cretaceous and Tertiary strata (Figure 17). The shoals appear as a nearshore low-backscatter area in side-scan imagery (Figure 7), and contain sediment ranging 1 - 6 m in thickness (Figure 17). Sediment within these shoals overly the regional transgressive unconformity (Figure 11) and appear to be associated with the Waites Island transgressive barrier, and the Little River and Hog inlet systems that bound it to the north and south, respectively. The largest accumulations of sediment are offshore Murrells Inlet, where three nearly shore-perpendicular shoals extend from the coast to the seawardmost reaches reaches of the study area (Figures 13 and 15). The shoals show up as three distinct low-backscatter areas in the side-scan sonar imagery (Figures 7 and 15), and likely represent the landward retreat pathway of the Murrels Inlet system over time. Sediment within each shoal is typically 1 - 3 m thick, locally exceeding 4 m (Figure 15). Superimposed on these shoals are bedforms of varying magnitude, including a series of well-defined, shore-oblique ridges oriented ~ 50° to the shoreline (Figures 2 and 15). In the swales between ridges, and to the north and south of the shoal complexes, sediment thins, exposing the underlying continental shelf and paleochannel deposits on the sea floor (Figure 13). Sidescan-sonar data illustrate this situation, as large low-backscatter regions, representing the shoals, are separated by thin high-backscatter lineations, which represent exposure of the underlying strata (Figures 7 and 15). The paleochannel deposits exposed in the swales between these ridges are part of the underlying Murrells Inlet valley fill (Figures 13 and 14). South of the Murrells Inlet area, offshore of Pawleys Island, significant sediment accumulations are contained within fields of shoreface-attached and shoreface-detached ridges (Figure 20). The shoreface-attached ridges are oriented ~ 35° oblique to the shoreline and exhibit sediment thickness generally less than ~ 3 m (Figures 17 and 20). Shoreface-detached ridges are oriented ~ 45° to 50° to the coast (Figure 17), with sediment thickness ranging from < ~ 2 m to 4 - 6 m (Figures 17 and 20). Strata underlying the shoreface attached and detached ridges are exposed within swales where surfical sediment is thin (Figure 20).
A third inlet-associated shoal complex is evident on the southern edge of the survey offshore of North Inlet (Figure 17). Though much smaller than the shoals associated with Murrels Inlet, sediment thickness values associated with this feature are between 1 and 3 m. The proximity of the previously mentioned large shoreface-detached ridges suggests that they may be a seaward extension of this inlet-associated shoal complex.
|