Skip past header information USGS Logo with link to USGS web page
Coastal Vulnerability Assessment of Olympic National Park to Sea-Level Rise, USGS Open-File Report 2004-1021


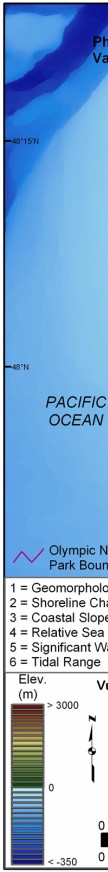
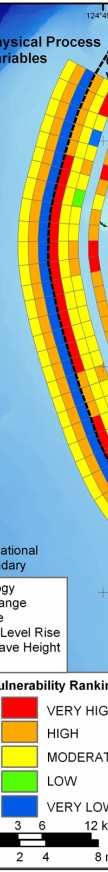
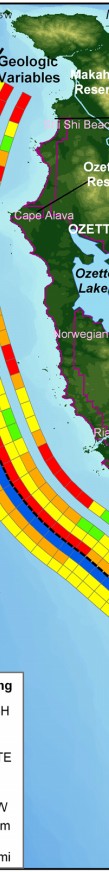
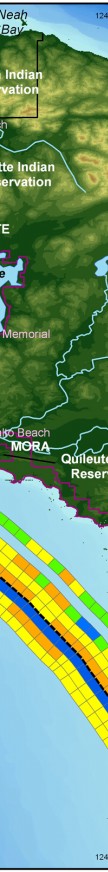
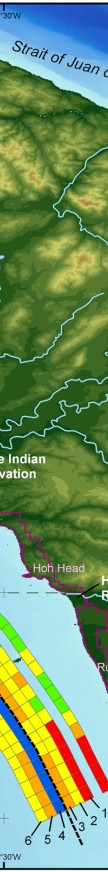
Figure 12. Relative Coastal Vulnerability for Olympic National Park. The innermost color bar is the relative coastal vulnerability index (CVI). The remaining color bars are separated into the geologic variables (1-3) and physical process variables (4 - 6). The very high vulnerability shoreline is generally located along sandy and gravel beaches where regional coastal slope is low. High vulnerability shoreline is concentrated north of Mora. Moderate vulnerability and low vulnerability coastline is mostly south of Mora.


Figure 12. Relative Coastal Vulnerability for Olympic National Park. Figure 12. Relative Coastal Vulnerability for Olympic National Park. Figure 12. Relative Coastal Vulnerability for Olympic National Park. Figure 12. Relative Coastal Vulnerability for Olympic National Park. Figure 12. Relative Coastal Vulnerability for Olympic National Park. Figure 12. Relative Coastal Vulnerability for Olympic National Park.

Skip Footer Information
Department of Interior
 /  U.S. Geological Survey  /  Coastal and Marine Geology / 

USGS Privacy Statement  /  Disclaimer  /  Accessibility
This is http://pubs.usgs.gov/pubs/of/2004/1021/html/fig12.html
Maintained by Eastern Publications Web Team
Modified Saturday, 12-Jan-2013 23:19:49 EST