
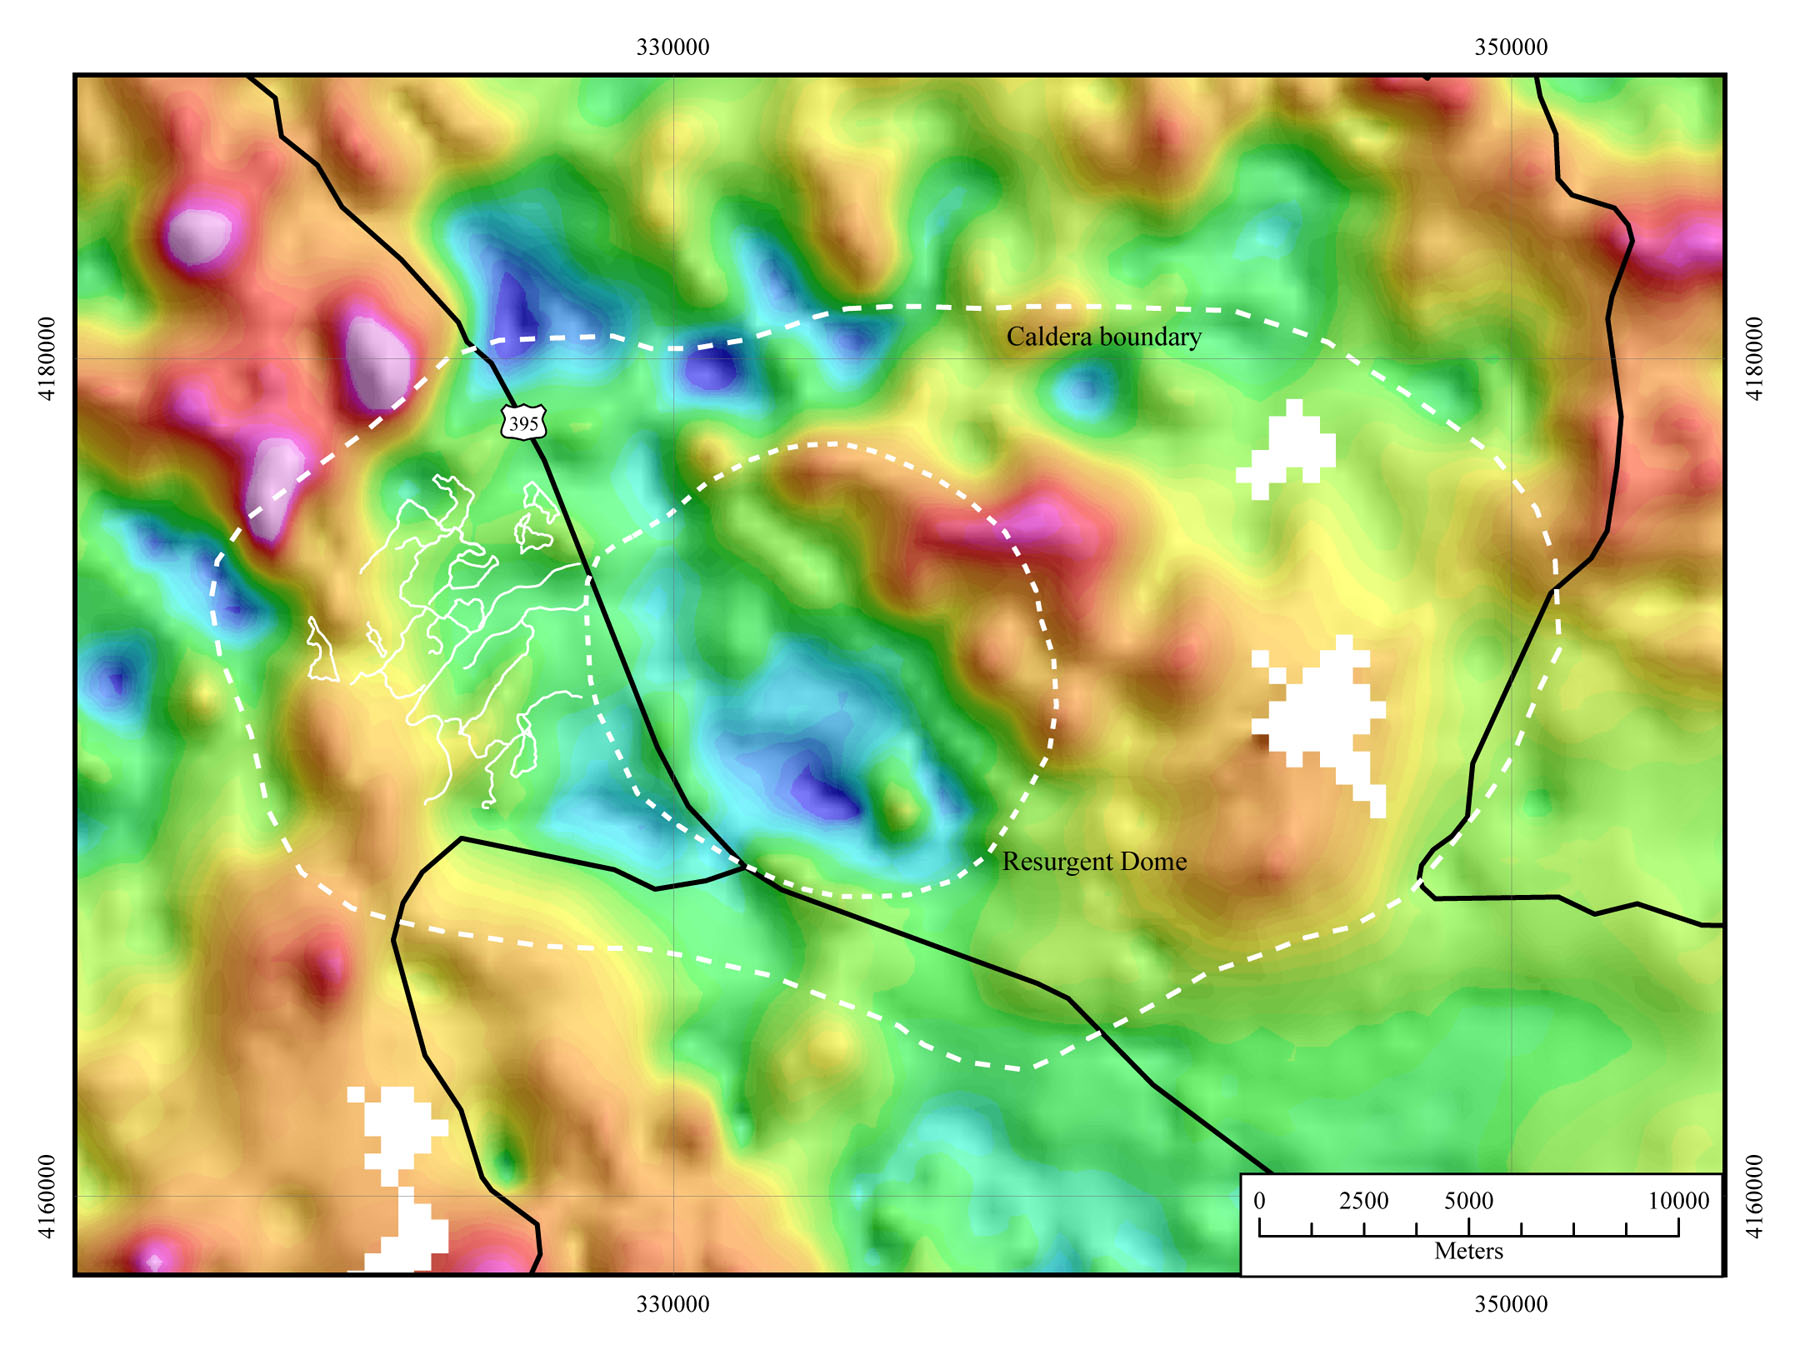
Figure 3 - Aeromagnetic map of the Long Valley Caldera. Warm
colors represent magnetic highs; cool colors represent magnetic
lows. The
magnetic low in the northwestern portion of the caldera could possibly
be due to hydrothermal alteration of the Bishop Tuff, whereas the
magnetic high in the east is thought to represent the unaltered Bishop
Tuff. Data have been merged from Roberts and Jachens
(1999).
| AccessibilityFOIAPrivacyPolicies and Notices | |
| |
|