
Coastal Vulnerability Assessment of Gateway National Recreation Area to Sea-Level Rise
USGS Open-File Report 2004-1257
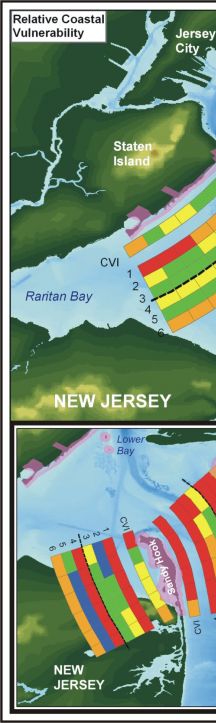
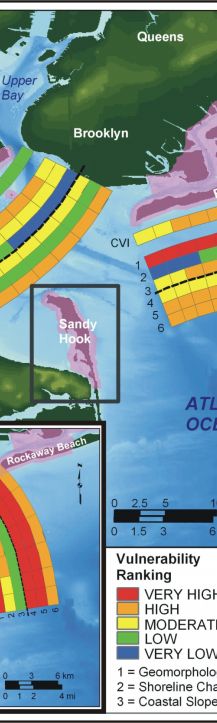
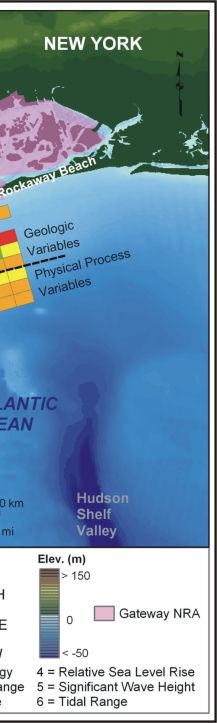
Figure 7. Relative Coastal Vulnerability for Gateway National Recreation Area. The innermost color bar is the relative coastal vulnerability index (CVI). The remaining color bars are separated into the geologic variables (1-3) and physical process variables (4 - 6). The very high vulnerability shoreline is generally located along Sandy Hook where shoreline change rates and wave heights are highest. High vulnerability shoreline is along the eastern end of the Breezy Point District. Moderate and low vulnerability shoreline is concentrated along the Staten Island Unit. | ||
 |
 |
 |
