
![]()
Prepared in cooperation with the San Luis Obispo County Planning and Building Department
By Thomas L. Holzer1, Thomas E. Noce1, Michael J. Bennett1, Carola Di Alessandro1, John Boatwright1, John C. Tinsley, III1, Russell W. Sell1, and Lewis I. Rosenberg2
Use of any trade, firm or product name is for descriptive purposes only and does not constitute endorsement by the U.S. Government.

Aerial view of Oceano, California, and dune field in Pismo Dunes Natural Preserve. View southward. (Courtesy of Keyhole, Inc.)
Download this report as a PDF document (15.1 MB)
The USGS investigation identified two earthquake hazards in Oceano that explain the San Simeon earthquake damage–site amplification and liquefaction. Site amplification is a phenomenon observed in many earthquakes where the strength of the shaking increases abnormally in areas where the seismic-wave velocity of shallow geologic layers is low. As a result, earthquake shaking is felt more strongly than in surrounding areas without similar geologic conditions. Site amplification in Oceano is indicated by the physical properties of the geologic layers beneath Oceano and was confirmed by monitoring aftershocks.
Liquefaction, which is also commonly observed during earthquakes, is a phenomenon where saturated sands lose their strength during an earthquake and become fluid-like and mobile. As a result, the ground may undergo large permanent displacements that can damage underground utilities and well-built surface structures. The type of displacement of major concern associated with liquefaction is lateral spreading because it involves displacement of large blocks of ground down gentle slopes or towards stream channels. The USGS investigation indicates that the shallow geologic units beneath Oceano are very susceptible to liquefaction. They include young sand dunes and clean sandy artificial fill that was used to bury and convert marshes into developable lots. Most of the 2003 damage was caused by lateral spreading in two separate areas, one near Norswing Drive and the other near Juanita Avenue. The areas coincided with areas with the highest liquefaction potential found in Oceano.
Areas with site amplification conditions similar to those in Oceano are particularly vulnerable to earthquakes. Site amplification may cause shaking from distant earthquakes, which normally would not cause damage, to increase locally to damaging levels. The vulnerability in Oceano is compounded by the widespread distribution of highly liquefiable soils that will reliquefy when ground shaking is amplified as it was during the San Simeon earthquake. The experience in Oceano can be expected to repeat because the region has many active faults capable of generating large earthquakes. In addition, liquefaction and lateral spreading will be more extensive for moderate-size earthquakes that are closer to Oceano than was the 2003 San Simeon earthquake.
Site amplification and liquefaction can be mitigated. Shaking is typically mitigated in California by adopting and enforcing up-to-date building codes. Although not a guarantee of safety, application of these codes ensures that the best practice is used in construction. Building codes, however, do not always require the upgrading of older structures to new code requirements. Consequently, many older structures may not be as resistant to earthquake shaking as new ones. For older structures, retrofitting is required to bring them up to code. Seismic provisions in codes also generally do not apply to nonstructural elements such as drywall, heating systems, and shelving. Frequently, nonstructural damage dominates the earthquake loss.
Mitigation of potential liquefaction in Oceano presently is voluntary for existing buildings, but required by San Luis Obispo County for new construction. Multiple mitigation procedures are available to individual property owners. These procedures typically involve either changing the physical state of the underlying sands so they cannot liquefy or building a foundation that can resist the permanent displacement of the ground. Lateral spreading, which is the major threat to underground utilities, is particularly challenging to mitigate because typically large areas are involved and sizeable volumes of soil must be prevented from moving. Procedures to prevent spreading commonly require subsurface barrier walls. Prevention of lateral spreading may also require community rather than individual efforts because of the scale and cost of these mitigation measures.
The 22 December 2003 San Simeon, California, (M6.5) earthquake, which occurred on a previously unrecognized reverse fault, caused significant damage to buildings and lifelines in San Luis Obispo County (Hardebeck and others, 2004). While most of the reported damage occurred near the fault that produced the earthquake, significant damage unexpectedly occurred at Oceano, California, approximately 63 km from the southeastward end of the fault rupture and 80 km from epicenter (Figure 1). Houses, road surfaces, and underground utilities were damaged (Figure 2). Although most of the structural damage was caused by liquefaction and associated lateral spreading, some damage was caused by strong ground shaking. Damage and liquefaction at 63 km from a M6.5 earthquake is unusual and implies that local geologic conditions beneath Oceano may have enhanced the impact of the earthquake (e.g., see Abrahamson and Silva, 1997; Boore and others, 1997; Ambraseys, 1988; Keefer, 1984; Youd and Perkins, 1978 for dependence of ground shaking and liquefaction occurrence on distance). To evaluate this possibility as well as the liquefaction potential and cause of the lateral spreading, the USGS explored subsurface conditions and monitored aftershocks in the months after the earthquake. This report presents preliminary findings with regard to the liquefaction hazard, lateral spreading, and potential for local amplification of seismic shaking at Oceano and summarizes methods for mitigating the hazards.

Figure 1. Map of San Luis Obispo County, California, with projected slip surface of San Simeon M6.5 earthquake (Hardebeck and others, 2004), epicenters of 1952 Bryson M6.2 and 2003 San Simeon M6.5 earthquakes, strong motion stations along general azimuth from the 2003 earthquake to Oceano, and buildings with red and yellow tags in unincorporated areas.

Figure 2. Damage to house at 1157 Norswing Drive in Oceano, California, from lateral spreading. Head scarp offset foundation of house. Photograph by Thomas L. Holzer.
Most of the damage to houses, road surfaces, and underground utilities in Oceano during the San Simeon earthquake was caused by two lateral spreads associated with liquefaction (Figure 3). The larger lateral spread was subparallel to Norswing Drive, and will be referred to as the Norswing Drive lateral spread. It was approximately 520 m long and 75 m across. The head scarp of the spread traversed obliquely across the topography, particularly on its north end. The other lateral spread, the head scarp of which was perpendicular to McCarthy and Juanita Avenues, was only about 75 m long and 90 m across. It will be referred to as the Juanita Avenue lateral spread. Its head scarp, which was on the western side of the lateral spread, was defined by a broad zone of extension. Both lateral spreads formed on very gentle slopes, although the northern end of the Norswing Drive lateral spread occurred on a slope of about 5%. Horizontal translation was generally downslope. Cumulative horizontal displacements inferred from opening and compression across ground cracks at both of the lateral spreads were small (<30 cm). Discrete vertical offsets across individual ground cracks were less than 5 cm. Displacements across cracks continued to increase for weeks after the earthquake.

Figure 3. Map of Oceano, California, area with ground failure and liquefaction areas, USGS SCPT soundings and borings, and portable digital seismograph.
In addition to these two lateral spreads, several smaller ground failures and lateral spreads were observed (Figure 3). The most significant of these was a bearing capacity failure that damaged the southern levee of Arroyo Grande Creek at Cardoza Ranch, where sand boils also erupted over a large area in the ranch pasture to the south of the levee. A rare eyewitness account of this liquefaction was transcribed by one of the authors on January 5, 2004, from the recollection of Pat Cardoza. Mr. Cardoza, who owns the ranch, provided a description of the appearance of sand boils in his fields soon after the earthquake. He reported that muddy water began erupting from the ground and cracks about 10 to 15 minutes after the shaking stopped. Large volumes of water continued to discharge for as long as about 30 minutes after the earthquake. A transcription of the interview is provided in Appendix 1.
The USGS investigation in Oceano consisted of field reconnaissance to map surface effects from the earthquake, subsurface exploration by seismic cone penetration testing (SCPT) and drilling and sampling with a hollow stem auger, and monitoring of aftershocks. The field reconnaissance of liquefaction and associated ground failure in Oceano was conducted on January 5, 2004. General areas of liquefaction and ground failure were noted and samples of sand boils were retrieved during this reconnaissance. Ground cracks and sand boils were mapped with a handheld GPS unit. Following the January reconnaissance, subsurface conditions were explored from February 23 to March 5, 2004, with 37 SCPT soundings conducted with the USGS CPT truck (Noce and Holzer, 2003). Relative elevations and horizontal positions of the soundings that were near the lagoon on Meadow Creek were measured with a theodolite on March 4-5, 2004. Following preliminary analysis of the SCPT soundings, 5 locations were drilled with the USGS hollow stem auger (Youd and Bennett, 1983). Standard penetration tests were conducted and Shelby tube samples were retrieved. Penetration data from the 37 USGS SCPT soundings are available on the Web at http://quake.usgs.gov/prepare/cpt/. Samples from the borings are being analyzed and will be described in a separate report to be published later. Aftershocks were recorded with a portable digital seismograph in Oceano from January 28 to March 7, 2004.
SCPT soundings in this report are identified with two classification schemes. The formal USGS procedure is to name a sounding with a three letter county code (San Luis Obispo County = SOC) followed by a three digit number, e.g., SOC032. For simplicity in this report, soundings may be referred to only by their number, e.g., 32.
Oceano lies within the Central Coast Range province of California. This province, which extends from Monterey Bay to Santa Barbara, is distinguished by transpressive plate motion that is distributed over a complex system of active strike-slip faults, subparallel reverse and reverse-oblique faults, and folds (Clark and others, 1994). For a comprehensive discussion and maps of the regional geology, the reader is referred to Geological Society of America Special Paper 292 (Alterman and others, 1994) from which the following summary was derived. The Coast Range province consists of five structurally and stratigraphically distinct seismotectonic domains that are separated predominantly by faults with Quaternary activity. Oceano lies within the Santa Maria Basin/San Luis Range domain, which extends approximately from San Luis Obispo southward to the Santa Ynez Mountains. This domain forms a structural and geomorphic transition between the Transverse Ranges and the southern California Coast Ranges. It consists of multiple faulted and folded structural blocks. Oceano lies near the western margin of the fault bounded San Luis Obispo/Pismo structural block, an uplifted block forming the core of the San Luis Range (Lettis and Hall, 1994). The Los Osos Fault, a southwest dipping reverse fault, forms the northeast boundary of the domain near Oceano, and the Wilmar Avenue Fault, a northeast dipping reverse fault, forms the southeast boundary of the block. Both faults show evidence of Quaternary activity.
Oceano sits atop an approximately 240-m-thick sequence of gently westward dipping unconsolidated sediment that has been the subject of investigations prompted by salt-water intrusion into the coastal aquifer beneath Oceano (Weber and Hanamura, 1970). The uppermost sediment consists of a complexly interbedded sequence of Holocene dune sand, shallow marine or estuarine deposits, and fluvial sediments of Meadow and Arroyo Grande Creeks that rests on early Holocene/late Pleistocene (?) marine and estuarine sediments. The thickness of the Holocene dune and fluvial sediment sequences was generally less than 10 m as encountered in the USGS SCPT soundings. These sediments overlie approximately 100 m of beds that are equivalent to the Lower Pleistocene Paso Robles Formation and 140 m of upper Pliocene Careaga Sand, which is of primarily marine origin (Weber and Hanamura, 1970). These sediments in turn rest on sedimentary bedrock, the lower to upper Pliocene Pismo Sandstone.
The shallow (<30 m) geology beneath Oceano consists of a complex sequence of interfingering unconsolidated sediments. The complexity results from the interaction of multiple geologic environments that are active in the area. These environments include the floodplains of Meadow and Arroyo Grande Creeks, eolian (windblown) sand dunes, shallow bay, estuary, and marshes, and sandy beaches. The patterns of geologic deposition have been greatly influenced by a sea level fluctuation of about 100 m associated with the last Ice Age, also known as the Wisconsin glacial stage. Before about 15,000 years ago during the last Ice Age, little deposition occurred in the Oceano area and coastal streams eroded valleys into the landscape as they adjusted to the low stand of sea level. From 15,000 to 6000 years ago, sea level rose rapidly as the continental ice sheets melted away. Since 6000 years ago, sea level has risen slowly, and the positions of the beaches, dunes, marshes, and river deposits near Oceano reflect the interplay of storms, floods, waves and tides on the beaches, dunes, marshes, and river floodplains.

Figure 4. Oceano portion of 1873-1874 U.S. Coast Survey T-sheet 1393 with road network, modern hydrography (in light blue), and locations of USGS SCPT soundings superimposed. Stippled pattern denotes sandy areas including dune fields. Dark pattern denotes marshes along Meadow and Arroyo Grande Creeks.
Predevelopment surficial geologic and subsurface conditions in Oceano can be inferred from the 1873-1874 U.S. Coast Survey T-sheet 1393 (Figure 4). It reveals that the undisturbed surficial geology at Oceano was varied. Surficial deposits included fields of active to inactive sand dunes, marsh and tidal estuarine deposits, floodplain sediments deposited by Arroyo Grande and Meadow Creeks, and beach deposits along what is now Strand Way. Perhaps the most striking feature on the T-sheet is the extensive marsh along Meadow and Arroyo Grande Creeks. Most of this marsh has been filled in, with the modern lagoon on Meadow Creek (Oceano Lagoon) being the only remaining trace. Unpublished historical subdivision maps in the files of San Luis Obispo County show that the Norswing Drive and Juanita Avenue lateral spreads originally were within an area shown as "Boating park and cottage reservation" (1893) and "Willow Grove camping ground" (1899) adjacent to "Lake sOceano". These areas were subdivided and turned into developable lots by leveling dunes and filling in swamp areas with dune sand in March 1927 (J.D. McGregor, unpublished map, 1927). In addition to the modification of the landscape by extensive filling, comparison of the 1874 and modern channel of Arroyo Grande Creek in Figure 4 indicates that much of the original channel was filled and the active channel was relocated southwestward to an excavated channel at its present position.

Figure 5. Locations of cross sections, Oceano.
The surficial geology is illustrated in cross section in Figures 6a and 7a (See Figure 5 for locations). Cross section A-A’ (Figure 6a) extends from the Pismo Beach State Campground, which is north of Pier Avenue, southward to Arroyo Grande Creek. Cross section B-B’ (Figure 7a) extends eastward from the northern end of A-A’ to east of the Norswing Drive lateral spread.
In the northern part of cross section A-A’, the eolian or windblown deposits mapped on the 1874 T-sheet range from 3 to 6 m thick. In most of the remainder of the cross section, a 1- to 2-m-thick blanket of artificial fill has been placed over marsh, tidal estuarine, and floodplain deposits. The thickness of these deposits immediately beneath the artificial fill ranges from 3 to 5 m. All of these deposits rest on a continuous 5 to 9-m-thick sand layer, which we interpret, on the basis of preliminary analyses of core samples from the USGS drilling program, to be primarily beach and estuarine sand deposits. Several of the soundings in the cross section penetrate through the sand and into an estuarine deposit that is predominantly clayey silt.

Figure 6(a).

Figure 6(b).

Figure 6(c).
Figure 6. North-south cross section (A-A’) at Oceano of generalized shallow subsurface conditions based on SCPT soundings. See Figure 5 for location of cross section. Cross section includes profiles of CPT tip and friction ratio, geologic units, and water table with (a) shear-wave velocity (VS), (b) liquefaction factors of safety for a M6.5 and PGA=0.25 g, and (c) liquefaction factors of safety for a M6.8 and PGA=0.4 g.

Figure 7(a).

Figure 7(b).

Figure 7(c).
Figure 7. East-west cross section (B-B’) at Oceano of generalized shallow subsurface conditions based on SCPT soundings. See Figure 5 for location of cross section. Cross section includes profiles of CPT tip and friction ratio, geologic units, and water table with (a) shear-wave velocity (VS), (b) liquefaction factors of safety for a M6.5 and PGA=0.25 g, and (c) liquefaction factors of safety for a M6.8 and PGA=0.4 g.
In cross section B-B’ the shallow eolian deposit can be traced at the surface across the entire cross section except for the interval along Coolidge Drive where it is overlain by artificial fill and the marsh deposits shown on the 1874 T-sheet. The continuity of the eolian deposit suggests that the present position of Meadow Creek in Oceano is geologically recent. If this inference is correct, then Meadow Creek formerly discharged directly to the ocean north of Oceano. The thick beach and estuarine sand in cross section A-A’ can also be traced laterally in B-B’ eastward to the end of the cross section. As in A-A’, the sand layer is underlain by a predominantly clayey silt estuarine deposit. The beach and estuarine sand, however, may have been locally eroded and replaced with fluvial deposits directly beneath Meadow Creek and the lagoon on the basis of the SCPT signatures in soundings 1 and 3.
Ground shaking from the 2003 San Simeon earthquake was not instrumentally recorded at Oceano. This is unfortunate because the level of damage that was observed in Oceano is not normally expected at 63 km from a M6.5 earthquake. Shaking at this distance is typically well below damaging levels (for example, see Boore and others, 1997). Eyewitness accounts reported to the USGS “Did You Feel It?” Web site, however, indicate that the shaking was strongly felt at Oceano (http://pasadena.wr.usgs.gov/shake/ca/STORE/X40148755/ciim_display.html). The Web site collected many responses from Oceano and the surrounding communities immediately after the earthquake (Figure 8). The 21 responses from the Oceano zip code reported a median Modified Mercalli Intensity (MMI) of VII, which Wald and others (1999) associate with peak ground accelerations (PGA) that range from 0.18 to 0.32 g. Median intensities reported in nearby zip codes range from MMI V to VI, corresponding to PGA’s that range from 0.04 to 0.18 g. Thus, both the damage and high intensity reported at Oceano suggest shaking were unexpectedly high.
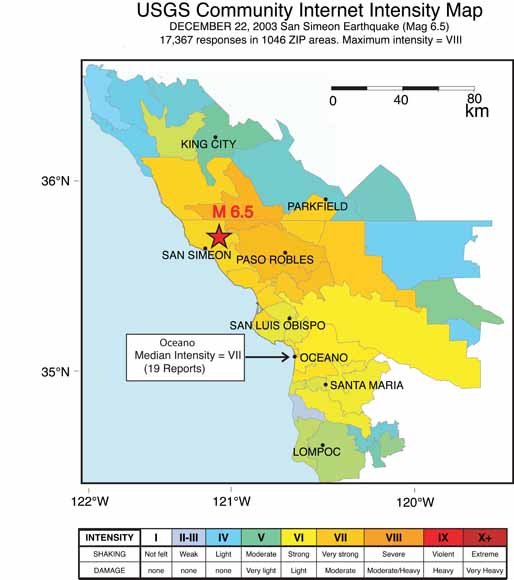
Figure 8. USGS Community Intensity Map for the 2003 San Simeon M6.5 earthquake. Oceano had 21 reports with a median Modified Mercalli Intensity of VII. Modified from map posted at http://pasadena.wr.usgs.gov/shake/ca/STORE/X40148755/.
Main-shock recordings at the five strong-motion stations that were located between the M6.5 rupture area and Oceano indicate that ground motion was relatively strong in the direction from the fault rupture towards Oceano (Figure 1). The stations range from Templeton, which was only 20 km from the rupture area, to Lopez Lake, which was 67 km from the end of the rupture, at approximately the same distance as Oceano. Three of these stations, Templeton, Point Buchon, and Lopez Lake, are operated by the California Strong Motion Instrumentation Program, while the San Luis Obispo and Park Hill stations, respectively, are operated by the USGS National Strong Motion Program and TriNet. Values of PGA recorded at four of these five stations are significantly larger than the average values for reverse fault earthquakes as regressed by Boore and others (1997) (Figure 9). Boatwright and Seekins (2004) attribute the higher level of shaking to directivity associated with the unilateral fault rupture to the southeast during the main shock. They show that PGA’s recorded at stations to the southeast of the main shock exceed PGA’s recorded at stations at comparable distances to the northwest by a factor of about three.

Figure 9. Median (±ς) PGA estimated for soft rock sites (VS30=750 m/s) for a M6.5 reverse fault earthquake (Boore and others (1997). PGA values recorded at strong motion stations along general azimuth from the 2003 San Simeon earthquake to Oceano are also shown. See Figure 1 for locations. Range of PGA inferred from USGS “Did you feel it?” also shown.
The recordings of the main shock at the five stations along the southeast azimuth are generally similar in duration; differences in amplitude and frequency content can be attributed to variations in local geologic conditions (Figure 10). To compare these recordings more directly, we correct for the effect of distance from the earthquake source by scaling the acceleration amplitudes by the distance between the station and the closest surface projection of the fault (the “Joyner-Boore distance” devised by Joyner and Boore (1981)). This scaling emphasizes the similarity between the accelerograms. The Point Buchon accelerogram is the least similar, and also has the lowest scaled acceleration. The Templeton accelerogram (PGA=0.47 g) has the largest scaled accelerations, and the Lopez Lake accelerogram (PGA=0.12 g) has the second largest. If the ground motion depended only on the distance to the rupture, we could use the recording (PGA=0.12 g) at Lopez Lake as an analog for Oceano. Because all five stations are at the same approximate azimuth from the rupture, the variation in scaled amplitude largely reflects differences in local geologic conditions. Point Buchon and Park Hill are sited on soft rock whereas Templeton and Lopez Lake are sited on stiff soil. Although San Luis Obispo occupies a sediment-filled valley, the station does not appear to be sited on soft deep soil similar to Oceano.
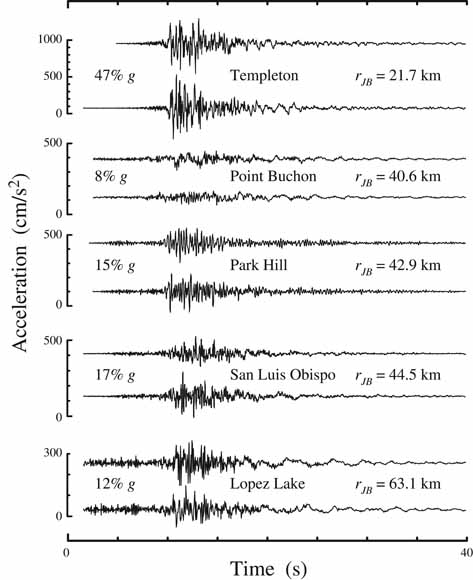
Figure 10. Horizontal ground accelerations recorded at strong motion stations along general azimuth from the 2003 San Simeon earthquake to Oceano. Amplitudes are scaled for distance from fault rupture.
The PGA at Oceano inferred from the USGS “Did you feel it?” Web site intensities exceeds the trend of PGA’s recorded at the four stations closest to Oceano (see Figure 9). Thus, directivity does not entirely explain the strong ground shaking in Oceano. To evaluate the possibility that shaking at Oceano during the San Simeon main shock was locally amplified, the USGS installed and operated a portable digital seismograph station near the corner of Norswing and Coolidge Drives from January 28 until March 22, 2004. This instrument, a REFTEK 72A-07 recorder with an Episensor accelerometer set, recorded many aftershocks, the largest of which was a M4.5 event on March 17, 2004.
Recordings of 11 aftershocks obtained at Oceano and Park Hill, six of which were also recorded at San Luis Obispo, were analyzed using the generalized method of spectral ratios devised by Boatwright and others (1991). The method effectively multiplies the main-shock Fourier amplitude spectra recorded at either Park Hill and San Luis Obispo by the spectral ratio of the aftershocks recorded at Oceano and either Park Hill or San Luis Obispo. The method of spectral ratios assumes that the ground at Oceano responded linearly during the main shock. Thus, it may overestimate the acceleration for soft soil sites, which can behave nonlinearly if ground shaking is strong enough.

Figure 11. Combined horizontal acceleration spectra for the Park Hill (PHL) and San Luis Obispo (1083) strong motion recordings and the estimated combined horizontal acceleration spectra for Oceano (OCE).
Combined horizontal acceleration spectra for the Park Hill and San Luis Obispo recordings are plotted in Figure 11 along with the combined estimated hori-zontal acceleration spectrum for Oceano. Amplification at Oceano is significant; the estimated main-shock spectrum for Oceano exceeds the recorded spectra at Park Hill and San Luis Obispo over the frequency band from 0.2 to 3 Hz, despite being 20 km further from the rupture area. This relative ampli-fication compares favorably with the higher “Did you feel it?” intensities reported at Oceano for the main shock.
Figure 12. Synthetic main-shock horizontal ground accelerations at Park Hill, San Luis Obispo, and Oceano scaled for distance from fault rupture based on the February 27, 2003, M3.8 aftershock. The PGA values indicated correspond to the stochastic realization plotted in the figure rather than the average PGA given in the text. Note the correspondence of the synthetic accelerogram for San Luis Obispo with the recorded accelerogram shown in Figure 10.
To estimate PGA at Oceano during the main shock, synthetic accelerograms were computed using the method proposed by Boore (2003). The method combines the spectral ratio of the main shock to an aftershock with the horizontal accelerograms for that same aftershock and a stochastic operator. We estimate the operator duration as 1 s by using the same technique to fit the main-shock accelerograms from San Luis Obispo and Park Hill. The resulting synthetic accelerograms are plotted in Figure 12. This technique estimates that the main-shock PGA was 0.29![]() 0.04 g at Oceano, where the variability is derived from the set of different realizations of the stochastic operator. As in the previous method of spectral ratios, the soil at Oceano is assumed to have behaved linearly during the main shock. Thus, the estimate is an upper bound for the PGA.
0.04 g at Oceano, where the variability is derived from the set of different realizations of the stochastic operator. As in the previous method of spectral ratios, the soil at Oceano is assumed to have behaved linearly during the main shock. Thus, the estimate is an upper bound for the PGA.
The capability of soft soil conditions to amplify earthquake shaking at a site above that which would be experienced if the site were underlain by rock is well established (Joyner and Boore, 1988). In fact, much damage during earthquakes is caused by this amplification effect, which is known as site response. Although amplification may be caused by focusing and wave-trapping from two- and three-dimensional velocity structure, the time averaged shear-wave velocity to a depth of 30 m, VS30, is widely used by building codes to predict amplification potential. The value of VS30 at a site determines the amplification factors that are the basis for seismic resistant design (BSSC, 2001). Table 1 shows the classification of VS30 that is used in the recent NEHRP provisions to predict amplification (BSSC, 2001). Five site categories are recognized and designated by letter in the NEHRP provisions. The site classes range from type E, which can produce the largest amplifications, to type A, which produces the smallest amplification.
Table 1. NEHRP site classes adopted from BSSC (2001).
|
Site Class |
Soil Profile Name |
VS30, m/s |
|
|
Minimum |
Maximum |
||
|
A |
Hard Rock |
>1500 |
|
|
B |
Rock |
>760 |
1500 |
|
C |
Very dense soil and soft rock |
>360 |
760 |
|
D |
Stiff soil |
180 |
360 |
|
E |
Soft soil |
|
<180 |
Shear-wave velocity measured in the SCPT soundings indicate that Oceano is underlain by soil type D (180<VS30<360), which has the second highest amplification (Figures 13 and 14). The average VS30 is 224 m/s (![]() 21 m/s) and ranges from 172 to 264 m/s. Values of VS30 were estimated because most SCPT soundings reached depths of only approximately 20 m. To estimate VS30, we assumed that the velocity measured in the lower part of the sounding characterized the depth interval between the bottom of the sounding and 30 m. The extrapolation is reasonable because the Pleistocene unconsolidated sediment penetrated by deep water wells at Oceano is approximately 100-m thick (Weber and Hanamura, 1970); therefore, abrupt velocity changes in the upper 30 m are unlikely.
21 m/s) and ranges from 172 to 264 m/s. Values of VS30 were estimated because most SCPT soundings reached depths of only approximately 20 m. To estimate VS30, we assumed that the velocity measured in the lower part of the sounding characterized the depth interval between the bottom of the sounding and 30 m. The extrapolation is reasonable because the Pleistocene unconsolidated sediment penetrated by deep water wells at Oceano is approximately 100-m thick (Weber and Hanamura, 1970); therefore, abrupt velocity changes in the upper 30 m are unlikely.

Figure 13. Map of VS30 values inferred from USGS SCPT soundings.
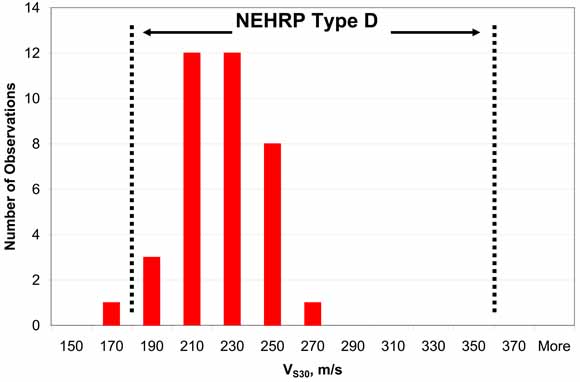
Figure 14. Histogram of VS30 values inferred from USGS SCPT soundings. Range of VS30 for NEHRP site class D is from BSSC (2001).
In addition to the low shear-wave velocity of near-surface sediments, the thickness of the unconsolidated sediment that underlies Oceano is significant. In general, the thicker the sediment, the greater the amplification, i.e., the broader the range of periods that are amplified. This is relevant to long distance events, which will generate long period ground shaking in Oceano.
The liquefaction potential of geologic sediment beneath Oceano was evaluated with the factor of safety predicted by the Seed-Idriss simplified procedure (Seed and Idriss, 1971; Seed and others, 1985) as modified for the CPT by Robertson and Wride (1997). The factor of safety in the simplified procedure is the ratio of liquefaction resistance of a soil element at a specified depth to the load imposed by the earthquake. The liquefaction resistance typically is computed from penetration resistance measured by either cone or standard penetration testing. The load imposed by the earthquake is computed from the PGA and the effective stress acting on the soil element. The simplified procedure is the standard geotechnical method used in the United States to evaluate liquefaction potential. Readers who are unfamiliar with the methodology are referred to the cited references for details.
Liquefaction potential in Oceano was also evaluated with the liquefaction potential index (LPI). The index offers two major advantages over the factor of safety. First, SCPT soundings provide extensive penetration data that can be used to compute multiple factors of safety. LPI combines all of the factors of safety from a single sounding into a unique value. Thus, LPI provides geographically unique values that are useful for regional evaluations of liquefaction potential. Second, LPI has been empirically correlated with liquefaction effects and thereby provides an estimate of the severity of liquefaction at a specific location. By contrast, the simplified procedure provides an estimate of the liquefaction potential only for a soil element. LPI, which was originally defined by Iwasaki and others (1978) in Japan, is not as widely used in U.S. practice as the simplified procedure, so the following summary description is provided.
LPI was originally defined and developed to estimate the potential of liquefaction to cause foundation damage (Iwasaki and others, 1978). The index assumes that the severity of liquefaction is proportional to the:
(1) thickness of the liquefied layer;
(2) proximity of the liquefied layer to the surface; and
(3) amount by which the factor safety (FS) is less than 1.0, where FS is the ratio of the liquefaction resistance to the load imposed by the earthquake.
The index evaluates liquefaction only to a depth of 20 m. The index was defined as:
![]() (1)
(1)
where
F = 1 – FS for FS ≥ 1, and
F = 0 for FS > 1, and
w(z) = 10 – 0.5 z, where z is the depth in meters.
The factor of safety in equation 1 that was used for the present investigation is from the simplified procedure as modified for application to cone penetration testing by Robertson and Wride (1997). Depth to ground water is taken into account through the factor of safety, which is greater than one above the water table.
Values of LPI for equation 1 can range from 0, for a site with no liquefaction potential, to a maximum of 100, for a site where the factor of safety is zero over the entire 20-m-depth range. Although LPI relies on the simplified procedure to estimate factors of safety, the prediction by LPI is more comprehensive than that made by the simplified procedure. The simplified procedure predicts the performance of a soil element whereas LPI predicts the performance of the whole soil column to a depth of 20 m.
The significance of LPI values has been evaluated by Iwasaki and others (1982) and Toprak and Holzer (2003), who compiled case histories that compared LPI with observed severity of liquefaction. Iwasaki and others (1982) concluded that severe liquefaction is likely at sites with LPI > 15 and that severe liquefaction is unlikely at sites with LPI < 5. Toprak and Holzer (2003) correlated surface manifestations of liquefaction with LPI for the 1989 Loma Prieta, California, earthquake and concluded that sand boils occur where LPI ≥ 5 and lateral spreads occur where LPI ≥12. For mapping liquefaction hazard, the USGS uses an LPI ≥5 to predict areas of potential liquefaction hazard (Holzer and others, 2002).
Table 2. Elevations of soundings and depths to ground water used for liquefaction analysis. Factors of safety were computed with inferred water table. Observed water tables are from USGS borings drilled March 22-26, 2004.
|
CPT |
Elevation, m |
Depth to water table, m |
CPT |
Elevation, m |
Depth to water table, m |
||
|
Inferred1 |
Observed |
Inferred1 |
Observed |
||||
|
SOC001 |
2.040 |
0.52 |
|
SOC020 |
7.010 |
5.20 |
|
|
SOC002 |
2.793 |
1.08 |
|
SOC021 |
9.144 |
7.33 |
|
|
SOC003 |
3.732 |
1.79 |
|
SOC022 |
2.764 |
1.24 |
|
|
SOC004 |
4.494 |
2.35 |
|
SOC023 |
0 |
0 |
|
|
SOC005 |
6.146 |
3.79 |
|
SOC024 |
0 |
0 |
|
|
SOC006 |
8.028 |
6.50 |
|
SOC025 |
2.480 |
0.96 |
|
|
SOC007 |
2.457 |
0.93 |
|
SOC026 |
2.323 |
0.80 |
|
|
SOC008 |
2.269 |
0.75 |
|
SOC027 |
3.353 |
1.27 |
|
|
SOC009 |
2.563 |
1.04 |
|
SOC028 |
3.353 |
1.27 |
1.3 |
|
SOC010 |
4.946 |
4.11 |
6.6 |
SOC029 |
3.353 |
1.27 |
|
|
SOC011 |
4.296 |
2.59 |
|
SOC030 |
2.908 |
1.38 |
1.8 |
|
SOC012 |
3.395 |
1.87 |
|
SOC031 |
5.192 |
3.67 |
|
|
SOC013 |
7.286 |
5.20 |
|
SOC032 |
2.975 |
1.45 |
|
|
SOC014 |
5.284 |
3.42 |
|
SOC033 |
2.764 |
1.24 |
|
|
SOC015 |
3.147 |
1.62 |
1.7 |
SOC034 |
2.604 |
1.08 |
|
|
SOC016 |
5.310 |
3.36 |
|
SOC035 |
6.372 |
2.71 |
|
|
SOC017 |
2.616 |
1.09 |
|
SOC036 |
6.372 |
2.71 |
|
|
SOC018 |
6.027 |
4.22 |
|
SOC037 |
6.372 |
2.71 |
|
|
SOC019 |
13.411 |
11.6 |
11.6 |
|
|
|
|
1 Inferred values of the water table were used for liquefaction hazard computations.
The factor of safety against liquefaction in the simplified procedure includes a correction for vertical effective stress. This requires knowledge of the depth to the water table. The depth to the water table used for the liquefaction evaluations in Oceano are summarized in Table 2. Inferred depths were used because the holes created by the SCPT soundings closed near the surface immediately after withdrawal of the sounding rods and did not permit measurement of the depth to ground water. For soundings in the general proximity of the lagoon, inferred depths are based on the water-level elevation observed in the lagoon on March 4-5, 2004. Depths were computed by subtracting the elevation of the water surface in the lagoon from the elevation of each sounding. For soundings near the Norswing Drive lateral spread, the elevation of the water table was modified by arbitrarily assuming that the water table had a 1% eastward gradient toward the lagoon. The gradient toward the lagoon was assumed to ensure a conservatively high water table. For soundings not near the lagoon (SOC019-SOC021 and SOC027-SOC029) depth to ground water was inferred from water levels measured in the adjacent USGS soil borings at SOC019 and SOC028 drilled on March 22-26, 2004. Depth to ground water at soundings SOC035-SOC037, which are on a river levee, was estimated from the elevation of the soundings relative to Arroyo Grande Creek.
Even without conducting a comprehensive geotechnical analysis, the surficial geology and shallow water table at Oceano suggests a significant liquefaction hazard is present. Much of the surficial geology consists of eolian deposits of geologically young, clean sand. Experience in many earthquakes has demonstrated that such sediment is highly susceptible to liquefaction when it is saturated (Youd and Perkins, 1978). The liquefaction hazard in Oceano was further increased by the manner in which the natural landscape was modified. As previously noted, sand dunes were excavated for early land development and the borrow material was placed as unengineered artificial fill to raise the land surface in the low-lying floodplains, marshes, and estuarine areas. As a result, much of the modern development occurred on artificial fill that consists primarily of loose, clean, fine sand that is very susceptible to liquefaction where it is below the water table.
Widespread liquefaction during the 2003 San Simeon earthquake substantiates the inferred regional liquefaction hazard in Oceano. In addition, to the Norswing Drive and Juanita Avenue lateral spreads, permanent ground deformation, and sand boils were observed at many locations. These additional liquefaction effects were not mapped in detail by the USGS, but they were noted at the Oceano airport, along Pier Avenue, in Pismo Beach State Park, and at the Cardoza Ranch (Figure 3).
Analyses of the liquefaction potential at SCPT soundings in the two cross sections across Oceano are consistent with these field observations (Figures 6b and 7b). The analyses indicate that much of Oceano is underlain by sediment that is susceptible to liquefaction and predict that significant portions of the susceptible sediment liquefied in the 2003 earthquake. For each sounding in these cross sections (Figures 6b and 7b), factors of safety against liquefaction were computed for a M6.5 earthquake with PGA = 0.25 g, which is the approximate seismic loading that we infer for the 2003 earthquake. Intervals where liquefaction is predicted, i.e., factors of safety are less than one, are shown in red (FS ![]() 0.75) and orange (0.75 < FS < 1.0). Intervals where factors of safety were greater than one, but would be susceptible to liquefaction at higher levels of ground shaking, are shown in yellow. Approximately 10 to 75 percent of the intervals susceptible to liquefaction are predicted to have liquefied, i.e., FS < 1.0. Much of the sediment that is predicted either to have liquefied or to be susceptible to liquefaction is the artificial fill and undisturbed (natural) eolian or fluvial sediment.
0.75) and orange (0.75 < FS < 1.0). Intervals where factors of safety were greater than one, but would be susceptible to liquefaction at higher levels of ground shaking, are shown in yellow. Approximately 10 to 75 percent of the intervals susceptible to liquefaction are predicted to have liquefied, i.e., FS < 1.0. Much of the sediment that is predicted either to have liquefied or to be susceptible to liquefaction is the artificial fill and undisturbed (natural) eolian or fluvial sediment.
To establish the factors that determined the locations of the lateral spreads, subsurface conditions at the two major lateral spreads, Norswing Drive and Juanita Avenue, were explored with closely spaced SCPT soundings. Analysis of the soundings confirms that the lateral spreads occurred where underlying sediment is locally more susceptible to liquefaction. The liquefaction occurred in both artificial fill and undisturbed eolian sands.

Figure 15(a).
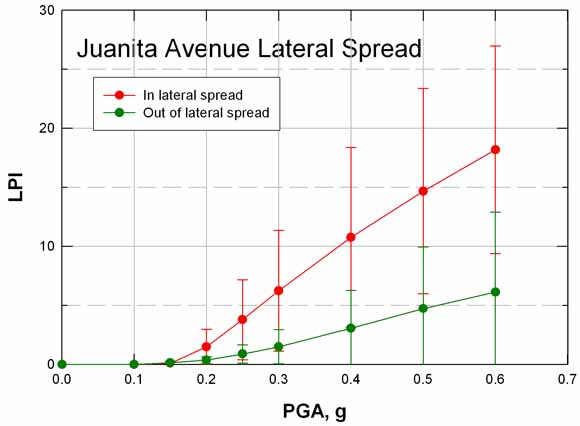
Figure 15(b).
Figure 15. (a) Mean LPI values (±ς) for soundings in and out of the Norswing Drive lateral spread; (b) Mean LPI values for soundings in and out of the Juanita Avenue lateral spread. Values were computed for a M6.5 earthquake and different levels of PGA.
Comparison of mean LPI values measured in and out of the lateral spreads at each lateral spread provides a synoptic view of the liquefaction potential (Figure 15). Mean LPI values were obtained by classifying soundings as either in or out of the lateral spread area, and then computing the mean value (at each PGA) for each group of soundings. Mean LPI values for soundings in the lateral spread are generally higher than the mean value for soundings outside of the lateral spread. This implies that the sediment at each lateral spread is more susceptible to liquefaction than is the sediment outside of the lateral spread.

Figure 16. Comparison of PGA values at Oceano inferred from aftershocks, liquefaction, and felt intensity with recorded PGA values and median (±ς) PGA estimated for soft rock site condition (VS30=750 m/s) for a M6.5 reverse fault earthquake (Boore and others, 1997).
Figure 15 also indicates that for a M6.5 earthquake, a PGA of at least 0.25 g is required to produce an average LPI value of 5 at the Oceano lateral spreads. This is a lower bound estimate based on the threshold LPI value at which surface manifestations of liquefaction are observed (Toprak and Holzer, 2003). The value is slightly smaller than the PGA of 0.29 g, which is an upper bound estimate, inferred for the main shock from the analysis of the M4.5 aftershock recorded at Oceano. Both values fall within the range of PGA values inferred from the USGS “Did you feel it? Web site statistics, 0.18 to 0.32 g. The three estimates are compared in Figure 16. The lower bound estimate of PGA=0.25 g is used for subsequent analyses of liquefaction potential caused by the 2003 San Simeon earthquake.

Figure 17(a).

Figure 17(b).

Figure 17(c).
Figure 17. Cross section C-C’ of Norswing Drive lateral spread along Coolidge Drive. See Figure 5 for location. Cross section includes profiles of CPT tip and friction ratio, geologic units, and water table with (a) shear-wave velocity (VS), (b) liquefaction factors of safety for a M6.5 and PGA=0.25 g, and (c) liquefaction factors of safety for a M6.8 and PGA=0.4 g.

Figure 18(a).
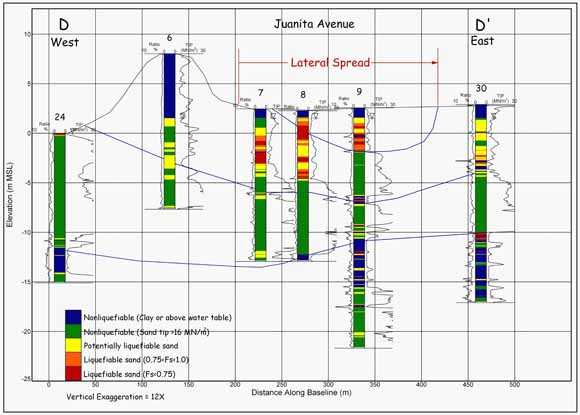
Figure 18(b).

Figure 18(c).
Figure 18. Cross section D-D’ of Juanita Avenue lateral spread along Juanita Avenue. See Figure 5 for location. Cross section includes profiles of CPT tip and friction ratio, geologic units, and water table with (a) shear-wave velocity (VS), (b) liquefaction factors of safety for a M6.5 and PGA=0.25 g, and (c) liquefaction factors of safety for a M6.8 and PGA=0.4 g.
Cross sections of both lateral spreads document the cause of the contrast of liquefaction resistance in and out of the lateral spread (Figures 17 and 18). The cross section across the Norswing Drive lateral spread is along Coolidge Drive (see Figure 4, C-C’ for location) and the cross section across the Juanita Avenue lateral spread is along Juanita Avenue (see Figure 4, D-D’ for location). The upper panel (a) in each figure shows the SCPT penetration profiles and shear-wave velocities. The middle panel (b) shows predicted factors of safety at each sounding for the M6.5 San Simeon earthquake and a PGA=0.25 g. The lower panel (c) shows predicted factors of safety for a scenario earthquake to be discussed later.
The cross section of the Norswing Drive lateral spread (Figure 17a), indicates that the lateral spread is coincident with the clean sandy artificial fill that was placed over the 1874 marsh. An approximately 1- to 1.5-m-thick interval where predicted factors of safety are less than one (red and orange) can be traced beneath the lateral spread at the base of the artificial fill, which suggests that the lateral spread is associated with liquefaction of artificial fill (Figure 17b). The head scarp–the eastern boundary–of the lateral spread is coincident with the eastern margin of the artificial fill; the toe of the lateral spread–the western boundary–appears to be determined by the decreased thickness of saturated artificial fill. Although liquefaction is predicted in some of the undisturbed eolian sand beneath the 1874 marsh layer, it is unclear that this liquefaction significantly contributed to the Norswing Drive lateral spread deformation. The inference about the significance of liquefaction in the artificial fill beneath Coolidge Drive, is consistent with factors of safety computed in the other soundings–SOC012, SOC015, and SOC017–in the Norswing Drive lateral spread. Factors of safety in all three soundings predict that most of the liquefaction occurred in the artificial fill.
The cross section of the Juanita Avenue lateral spread (Figure 18a) also indicates that artificial fill liquefied and contributed to the lateral spreading. However, predicted factors of safety in the cross section indicate undisturbed eolian sediment beneath the artificial fill also contributed to the lateral spreading (Figure 18b). This is indicated in the cross section where the western boundary of the lateral spread is interpreted to overlie undisturbed eolian sand. The contribution of liquefaction in undisturbed eolian deposits to the lateral spreading is supported by analyses of McCarthy Avenue soundings SOC022, SOC025, and SOC026. Artificial fill is either thin or absent on McCarthy Avenue and the liquefaction is interpreted to be occurring in undisturbed eolian sediment. Thus, the Juanita Avenue lateral spread appears to be caused by liquefaction of both artificial fill and undisturbed eolian deposits.
Although predicting the magnitude, location, and date of future earthquakes remains elusive to earthquake scientists, comprehensive seismotectonic knowledge of a region permits identification of their likely ranges of magnitudes, locations, and rates of occurrence. This kind of knowledge is the basis for the USGS National Seismic Hazard Map, which predicts the frequency of occurrence of strong ground shaking. For California, the National map was prepared by the USGS in collaboration with the California Geological Survey (CGS). It represents the consensus of the Earth sciences community on the shaking hazard at Oceano. These maps and information about them are available at http://eqhazmaps.usgs.gov/ and http://www.consrv.ca.gov/CGS/rghm/psha/. The USGS National Seismic Hazard Map is used here to evaluate the earthquake potential implications for the liquefaction hazard at Oceano. These maps are used because of the recency (2002) of publication of these maps and because a site-specific investigation of the earthquake potential near Oceano was beyond the scope of the present investigation.
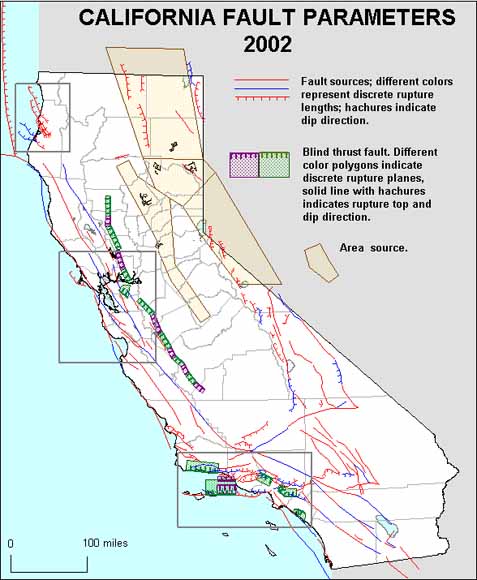
Figure 19. Map of active faults in California used for the USGS National Seismic Hazard Map (http://www.consrv.ca.gov/CGS/rghm/psha/fault_parameters/htm/)
Figure 19 shows the locations of faults that the USGS and CGS characterized as active and that they used to estimate the shaking hazard for the California region of the National Seismic Hazard Map. The earthquake potential of the faults is summarized by Petersen and others (1996). Three active faults are particularly relevant to Oceano because of their proximity. From west to east, they are the Hosgri, Los Osos, and Rinconada Faults. The better known San Andreas Fault is approximately 45 km to the east of Oceano. Of the first three faults, the Los Osos Fault, which is a southwest dipping reverse fault, is the closest, projecting to the surface approximately 5 km northeast of Oceano.

Figure 20. Deaggregated seismic hazard at Oceano for peak ground acceleration with a mean return time of 475 years. Hazard deaggregated from the USGS National Seismic Hazard Map. Graph was generated at http://eqhazmaps.usgs.gov/. The faults contributing to the hazard at 5, 15, and 22 km, respectively, are the Los Osos, Hosgri, and Rinconada Faults.
The contribution of each fault to the shaking hazard at Oceano can be assessed by a process known as seismic hazard deaggregation (McGuire, 1995). This process determines the significance of the faults and the earthquakes that contribute to the shaking hazard. The deaggregated probabilistic seismic hazard for PGA with a mean recurrence time of 475 yr (10 % in 50 yr) at Oceano is shown in Figure 20. It indicates that the Los Osos Fault, the source of ground shaking at 5 km, is the largest single contributor to the seismic hazard at Oceano as measured by PGA. The proximity (< 5 km) of the Los Osos Fault to Oceano also implies a potential for high levels of strong ground shaking. For additional information about the Los Osos Fault, the reader is referred to Lettis and Hall (1994).
Although a M6.8 earthquake on the Los Osos Fault is likely to cause the highest levels of ground shaking that Oceano will experience, several independent lines of evidence indicate that Oceano is vulnerable to amplification of seismic shaking to damaging levels from earthquakes on more distant faults. First, Oceano was 63 km from the rupture surface and 80 km from the epicenter of the 2003 M6.5 San Simeon earthquake. As noted in the Introduction, shaking at this distance is normally too small to cause damage and liquefaction. Second, the average VS30 of sediments beneath Oceano, 224 m/s, predicts that local geologic conditions will amplify incoming seismic waves. Third, aftershocks of the San Simeon earthquake recorded in Oceano all caused anomalously high levels of shaking. And finally, Oceano experienced damage from a smaller, but equally distant earthquake in 1952, the M6.2 Bryson earthquake. The 1952 earthquake, which had an epicenter close to the 2003 San Simeon earthquake (Figure 1), caused damage in Oceano and Pismo Beach (San Luis Obispo County Telegram-Tribune, November 22, 1952, page 1).
Figures 19 and 20 indicate that there are many faults within 60 km of Oceano that have the potential to generate large earthquakes. Because of its amplification potential, Oceano may well be at risk from many of these earthquakes.
In addition to generating damaging ground shaking, a M6.8 earthquake on the Los Osos Fault is predicted to cause more liquefaction in Oceano than did the 2003 M6.5 San Simeon earthquake. This is illustrated in Figure 21a, which is a map of predicted LPI values for each SCPT sounding for a M6.8 earthquake on the Los Osos Fault with a PGA = 0.4 g. This level of ground shaking is predicted close to a M6.8 earthquake (see Boore and others, 1997). Comparison of maps of LPI for a Los Osos Fault scenario and for the 2003 San Simeon earthquake (Figure 21b) indicates that liquefaction for the M6.8 earthquake would be both more geographically widespread (areas where LPI ![]() 5) and more severe (higher values of LPI). Most of Oceano would exhibit surface manifestations of liquefaction from the nearby M6.8 earthquake. In fact, only two broad areas are not predicted to exhibit surface manifestations of liquefaction: the modern beach area and the area underlain by older sand dunes deposits east of Norswing Drive. Note that the predicted locations of liquefaction, i.e., LPI
5) and more severe (higher values of LPI). Most of Oceano would exhibit surface manifestations of liquefaction from the nearby M6.8 earthquake. In fact, only two broad areas are not predicted to exhibit surface manifestations of liquefaction: the modern beach area and the area underlain by older sand dunes deposits east of Norswing Drive. Note that the predicted locations of liquefaction, i.e., LPI ![]() 5, for the San Simeon earthquake (Figure 21b) generally agree with locations of liquefaction observed in 2003 (Figure 2). Factors of safety for the soundings in the four cross sections, A-A’ to D-D’, are also shown for the Los Osos Fault scenario earthquake (Figures 6c, 7c, 17c, and 18c).
5, for the San Simeon earthquake (Figure 21b) generally agree with locations of liquefaction observed in 2003 (Figure 2). Factors of safety for the soundings in the four cross sections, A-A’ to D-D’, are also shown for the Los Osos Fault scenario earthquake (Figures 6c, 7c, 17c, and 18c).

Figure 21(a) Map of LPI values for (a) M6.8 earthquake on the Los Osos Fault (PGA=0.4 g).
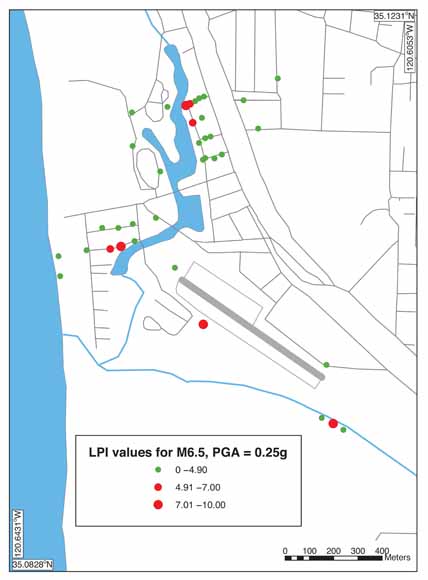
Figure 21(b) Map of LPI values for the 2003 San Simeon M6.5 earthquake (PGA=0.25 g). Surface manifestations of liquefaction are expected where LPI ≥5.
The percent of the total area of Oceano that will exhibit surface manifestations of liquefaction for a scenario earthquake can be estimated from the percentage of LPI![]() 5 (Holzer and others, 2003). Estimated areal percentages for a M6.8 earthquake for different PGA’s are shown in Figure 22. The estimates were made by computing LPI values for each of the 37 SCPT soundings for a M6.8 earthquake at a given PGA and determining the percent of LPI
5 (Holzer and others, 2003). Estimated areal percentages for a M6.8 earthquake for different PGA’s are shown in Figure 22. The estimates were made by computing LPI values for each of the 37 SCPT soundings for a M6.8 earthquake at a given PGA and determining the percent of LPI![]() 5. Approximately 60 % of Oceano is predicted to exhibit surface manifestations of liquefaction at a PGA=0.4 g. Although this estimate may be biased because soundings were not randomly located, it provides at least another indication of the potential seriousness of the liquefaction hazard at Oceano.
5. Approximately 60 % of Oceano is predicted to exhibit surface manifestations of liquefaction at a PGA=0.4 g. Although this estimate may be biased because soundings were not randomly located, it provides at least another indication of the potential seriousness of the liquefaction hazard at Oceano.

Figure 22. Percent of area in Oceano predicted to exhibit surface manifestations of liquefaction during a M6.8 earthquake as a function of PGA.
In addition to more extensive liquefaction from a nearby M6.8 earthquake on the Los Osos Fault, lateral spreading and associated permanent ground displacements potentially would be greater than those observed during the 2003 San Simeon earthquake. Such displacements would damage both structures and underground utilities such as waterlines and sewers. The potential range of permanent ground displacements can be estimated with the empirical method developed by Youd and others (1999). This method is based on a correlation of observed ground displacements with earthquake and geotechnical parameters from a database of world-wide case histories. Estimated permanent horizontal ground displacements at Oceano range from 0.8 to 3.9 m (Table 3). Displacements were estimated for free-face and slope models and a range of possible field conditions at a 5 km distance (R) from a M6.8 earthquake. The free-face model predicts displacements where the lateral spread moves toward a channel or steeply sloping surface, like the shore of Oceano lagoon on Meadow Creek. The parameter W is the ratio (in percent) of the height of the free face to the distance from the free face. The slope model predicts displacements on slopes, where S is the slope gradient. In both models, T15 is the cumulative thickness of the liquefied layers with normalized SPT blow counts less than 15; F15 is the average fines content of the layers; and D5015 is the mean grain size of the layers. T15 was estimated from CPT penetration resistance measurements by converting CPT tip resistance to equivalent SPT blow counts.
Table 3. Predicted lateral spreading displacements (Youd and others, 1999).
|
Free Face Model |
||||||
|
DH, m |
M |
R, km |
W (100H/L) |
T15, m |
F15, % |
D5015, mm |
|
0.8 |
6.8 |
5 |
1 |
3 |
5 |
0.2 |
|
1.9 |
6.8 |
5 |
5 |
3 |
5 |
0.2 |
|
2.7 |
6.8 |
5 |
10 |
3 |
5 |
0.2 |
|
Slope Model |
||||||
|
DH, m |
M |
R, km |
S, % |
T15, m |
F15, % |
D5015, mm |
|
1.0 |
6.8 |
5 |
0.1 |
3 |
5 |
0.2 |
|
1.8 |
6.8 |
5 |
0.5 |
3 |
5 |
0.2 |
|
2.9 |
6.8 |
5 |
2.0 |
3 |
5 |
0.2 |
|
3.9 |
6.8 |
5 |
5.0 |
3 |
5 |
0.2 |
DH, predicted displacement; M, earthquake magnitude; R, distance from earthquake; W, ratio (%) of the height of the free face (H) to the distance from the free face (L), and S, slope gradient; T15, cumulative thickness of liquefied layers with normalized SPT blow counts less than 15; F15, average fines content of layers; and D5015, mean grain size of layers.
Strong shaking and liquefaction damage at Oceano during the 2003 San Simeon earthquake was unexpected because of its 63-km distance from the earthquake. The post-earthquake subsurface exploration and monitoring of aftershocks, however, indicate that these effects are consistent with subsurface conditions at Oceano and could have been anticipated. These conditions indicate the area is both prone to local site amplification and susceptible to liquefaction. Both measurements of VS30 and recordings of aftershocks suggest that local geologic conditions in Oceano may amplify ground shaking. Thus, elevated levels of ground shaking should not have come as surprise and should be anticipated in future distant earthquakes. The surficial geology beneath Oceano includes extensive layers of clean eolian sand and sandy artificial fill. Both of these deposits are susceptible to earthquake-induced liquefaction when water tables are shallow, which is the prevailing condition in Oceano. Analyses of the 37 USGS SCPT soundings confirm the liquefaction potential of these deposits and generally predict the observed response of these deposits to the San Simeon earthquake.
Although this USGS investigation was prompted by the large distance of Oceano from the San Simeon earthquake, the community also may be subjected some day to near-source ground motion. The nearby Los Osos Fault shows evidence of Holocene offset and is assumed to be capable of generating a M6.8 earthquake. If such an earthquake were to happen, higher levels of ground shaking and much more extensive liquefaction and severe lateral spreading would occur in Oceano than did in 2003.
Finally, the earthquake hazard at Oceano is not unique. The experience in Oceano in 2003 is reminiscent of that in the Marina District of San Francisco during the 1989 M6.9 Loma Prieta earthquake. The Marina District, which was approximately 90 km from the earthquake, unexpectedly suffered extensive damage from local amplification of ground shaking and liquefaction (Holzer, 1998; O'Rourke, 1992). Subsurface conditions at the Marina District and Oceano and the resulting earthquake effects are remarkably similar.
Buildings, utilities, and highways when designed and built by engineers, architects, and contractors include consideration of their environment. In Oceano, earthquakes are part of that environment and must be considered if a structure is to perform safely during an earthquake. Efforts to reduce the impact of earthquake hazards are known as mitigation. Although avoidance of a hazard is the simplest form of mitigation, frequently this is impractical and hazard-resistant features must be incorporated into a structure in order to ensure its performance. In this section, alternative approaches to mitigation of earthquake hazards in Oceano are briefly summarized.
The USGS analysis of the effects of the San Simeon earthquake at Oceano indicates that local geologic conditions have created two separate earthquake hazards–site amplification and liquefaction. The site amplification is particularly troublesome because it causes Oceano to be susceptible to even distant earthquakes as the San Simeon earthquake demonstrated. This implies that Oceano will shake more strongly and frequently than surrounding areas without this geologic condition. It also implies that liquefaction may occur more frequently in parts of Oceano than it would otherwise. Mitigation of these two hazards require different approaches because the underlying natural processes are so different. Mitigation of the site amplification hazard requires structural modifications that will help structures resist the higher dynamic loads imposed by the earthquake. Mitigation of the liquefaction hazard requires either modifying the underlying soil or designing special foundations to protect the structure from differential permanent ground displacements, which may be both vertical (settlement) and horizontal (lateral spreading).
Ground shaking is generally mitigated in California through the Uniform Building Code (UBC, 1997), which describes procedures for dealing with the shaking hazard to a structure. Thus, adoption and enforcement of modern codes are critical for the most seismic resistant design. This requires that building officials be abreast of recent improvements and that builders be encouraged to incorporate them. Seismic provisions of building codes, however, continue to evolve and improve with each significant earthquake experience. Thus, a building, which is code compliant when it is built, may become noncompliant over time. Frequently noncompliant structures can be made compliant through retrofitting (ICBO, 2001). This may require community programs, e.g., low interest loans, to encourage property owners to engage in retrofitting activities.
The San Luis Obispo County Planning and Building Department regulates development in the community of Oceano. Areas of moderate to high liquefaction susceptibility are designated as county Geologic Study (GSA) zones. Projects within a GSA zone require site-specific geotechnical studies to evaluate the potential for liquefaction and mitigation measures to reduce these potential impacts.
Procedures to mitigate liquefaction are diverse because the hazard can be addressed by (1) either preventing the occurrence of liquefaction or reducing its effects and (2) foundation design. Procedures can be separated into four categories:
· Avoidance of liquefaction hazard
· Prevention of liquefaction
· Prevention of lateral spreading
· Special foundation design
The following paragraphs briefly review commonly used procedures in each category. For an evaluation of the performance of many of these procedures during the 1989 Loma Prieta, California, earthquake, the reader is referred to Mitchell and Wentz (1998).
Avoidance of areas susceptible to liquefaction is typically more practical before land is developed. Once development has occurred, proactive mitigation efforts are usually more cost effective.
Prevention of liquefaction is usually accomplished by densification of the liquefiable sand. Densification changes the sand structure so that it is unable to generate large excess pore pressures and liquefy. While densification is most easily done before construction, some procedures can be applied in open areas around buildings. The major procedures include:
· Dynamic compaction (dropping heavy weights on the land surface)
· Vibro-compaction (inserting a vibratory device into the liquefiable sand)
· Vibro-replacement (replacing sand by drilling and then vibro-compacting back fill in the bore hole)
· Compaction piles (driving piles and densifying surrounding soil)
In addition, (1) deep drains extending from the liquefiable layer to the surface may be installed to prevent build up of excess pore pressure that cause liquefaction and (2) grout (either a cement slurry or chemical) may be injected into the liquefiable sand to strengthen it. These procedures are known collectively as ground (or soil) improvement. The reader is referred to either Mitchell and others (1990), Port and Harbour Research Institute (1997), or Martin and Lew (1999) for more comprehensive descriptions and discussions of these mitigation procedures. The report by Mitchell and others (1990) is particularly relevant to Oceano. It was written for the City and County of San Francisco after the 1989 Loma Prieta, California, earthquake to address reconstruction in the Marina District. The response of the District and Oceano, respectively to the Loma Prieta and San Simeon earthquakes was strikingly similar.
Prevention of lateral spreading may be necessary where liquefaction mitigation at individual sites cannot adequately arrest the hazard or where protection of underground utilities is necessary. Where lateral spread displacements and size are large, prevention typically requires mitigation at a regional scale because spreading can overwhelm localized mitigation efforts. Subsurface barriers, which can be installed along streets, are one available procedure. Types of barriers that have been used include slurry walls (trenches filled with concrete), sheet-pile walls, and columnar walls consisting of either densely packed gravel or mixed in place soil and cement. Barrier walls also could be built by the ground improvement procedures described earlier for individual structures.
Special foundation design is an alternative where ground improvement is either not cost effective or could affect performance of adjoining structures. A grid or mat foundation with sufficient strength to resist differential displacements associated with liquefaction is commonly used for light structures such as small houses and buildings. Although a structure on the latter type of foundation may tilt when underlying soils liquefy, the strength of the foundation may be adequate to prevent physical damage to the structure. If the amount of tilting is consequential, the foundation permits the structure to be jacked up and releveled.
Piles and drilled-in-place caissons that penetrate through the liquefiable layer are a more costly alternative to the grid or mat foundation design. This is a common foundation design, particularly for heavy structures, in areas susceptible to liquefaction. Piles are columns that typically are made of steel or reinforced concrete on which a structure rests rather than the ground. To mitigate the liquefaction hazard, piles are driven through the liquefiable sand to firm material that will support the pile when the sand liquefies during an earthquake.
Liquefaction in Oceano during the San Simeon earthquake justifies the requirement by San Luis Obispo County that construction there consider the possibility of liquefaction. Because Oceano is the location of the most recent occurrence in California of earthquake-induced liquefaction, there is a critical need for liquefaction zonation by the California Geological Survey (CGS) as mandated under California State Law. Such zoning of potential areas of fault rupture, liquefaction, and landslides either has been or is being done in many urban areas in California by CGS. This hazard zoning was mandated by the 1972 Alquist-Priolo and 1990 Seismic Hazard Mapping Acts. Publication of a map triggers a regulatory process that requires local government to consider these hazards when issuing building permits for projects in zoned areas. For projects in designated hazard zones, a special study is required to determine if mitigation is necessary. For information about the hazard mapping program, the reader is referred to the Web site http://www.consrv.ca.gov/CGS/ and California Division of Mines and Geology (1997).
The authors appreciate reviews of drafts of the manuscript by David K. Keefer of the U.S. Geological Survey and Professor T. Leslie Youd of Brigham Young University. We also thank Joseph Schacherer for allowing us to install the temporary seismograph on his property.
Ambraseys, N.N., 1988, Engineering seismology: Earthquake Engineering and Structural Dynamics, v. 17, no. 1, p. 1-105.
Abrahamson, N.A., and Silva, W.J., 1997, Equations for estimating horizontal response spectra and peak acceleration from Western North America earthquakes: A summary of recent work: Seismological Research Letters, v. 68, no. 1, p. 128-153.
Alterman, I.B., McMullen, R.B., Cluff, L.S., and Slemmons, D.B., eds., 1994, Seismotectonics of the Central California Coast Ranges: Geological Society of America Special Paper 292, Geological Society of America, 236 p.
Boatwright, J., Seekins, L., Fumal, T.E., and Mueller, C.S., 1991, Ground motion amplification in the Marina District: Seismological Society of America Bulletin, v. 81, no. 5, p. 1980-1997.
Boatwright, J., and Seekins, L.C., 2004, Directivity in the near-field and regional recordings of the 22 December 2003 San Simeon earthquake: Seismological Research Letters, v. 74, no. 2, p. 265.
Boore, D.M., 2003, Phase derivatives and simulation of strong motions: Seismological Society of America Bulletin, v. 93, no. 3, p. 1132-1143.
Boore, D.M., Joyner, W.B., and Fumal, T.E., 1997, Empirical near-source attenuation relations for horizontal and vertical components of peak ground acceleration, peak ground velocity, and pseudo-absolute acceleration response spectra: Seismological Research Letters, v. 68, no. 1, p. 154-179.
BSSC, 2001, 2000 Edition NEHRP recommended provisions for seismic regulations for new buildings and other structures, FEMA 368, Part 1 (provisions): Federal Emergency Management Agency.
California Division of Mines and Geology, 1997, Guidelines for evaluating and mitigating seismic hazards in California: California Division of Mines and Geology Special Publication 117, 74 p.
Clark, D.G., Slemmons, D.B., Caskey, S.J., and dePolo, D.M., 1994, Seismotectonic framework of coastal central California, in Alterman, I.B., McMullen, R.B., Cluff, L.S., and Slemmons, D.B., eds., Seismotectonics of the Central California coast ranges, Geological Society of America Special Paper 292, p. 9-30.
Hardebeck, J.L., Boatwright, J., Dreger, D., Goel, R., Grazier, V., Hudnut, K., Ji, C., Jones, L., Langbein, J., Lin, J., Roeloffs, E., Simpson, R., Stark, K., Stein, R., and Tinsley, J., 2004, Preliminary report on the 22 December 2003, M6.5 San Simeon, California, earthquake: Seismological Research Letters, v. 75, no. 2, p. 155-172.
Holzer, T.L., 1998, Introduction, in Holzer, T.L., ed., The Loma Prieta, California, earthquake of October 17, 1989 - Liquefaction, U. S. Geological Survey Professional Paper 1551-B, p. B1-B8.
Holzer, T.L., Bennett, M.J., Noce, T.E., Padovani, A.C., and Tinsley, J.C., III, 2002, Liquefaction hazard and shaking amplification maps of Alameda, Berkeley, Emeryville, Oakland, and Piedmont: A digital database: U.S. Geological Survey 02-296 (http://geopubs.wr.usgs.gov/open-file/of02-296/).
Holzer, T.L., Bennett, M.J., Noce, T.E., and Tinsley, J.C., III, 2003, The application of the liquefaction potential index to liquefaction hazard mapping, in Eighth U.S.-Japan workshop on earthquake resistant design of lifeline facilities and countermeasures against liquefaction, Tokyo, Multidisciplinary Center for Earthquake Engineering Technical Report MCEER-03-0003, p. 161-171.
ICBO, 2001, Guidelines for seismic retrofit of existing buildings, 2000 edition: Whittier, CA, International Conference of Building Officials.
Iwasaki, T., Tatsuoka, F., Tokida, K.-i., and Yasuda, S., 1978, A practical method for assessing soil liquefaction potential based on case studies at various sites in Japan, in 2nd International conference on microzonation, San Francisco, p. 885-896.
Iwasaki, T., Tokida, K., Tatsuoka, F., Watanabe, S., Yasuda, S., and Sato, H., 1982, Microzonation for soil liquefaction potential using simplified methods, in Third International Earthquake Microzonation Conference, Seattle, p. 1319-1330.
Joyner, W.B., and Boore, D.M., 1981, Peak horizontal acceleration and velocity from strong-motion records including the 1979 Imperial Valley California earthquake: Seismological Society of America Bulletin, v. 71, no. 6, p. 2011-2038.
Joyner, W.B., and Boore, D.M., 1988, Measurement, characterization, and prediction of strong ground motion, in Von Thun, J.L., ed., Recent advances in ground-motion evaluation: New York, American Society of Civil Engineers, p. 43-102.
Keefer, D.K., 1984, Landslides caused by earthquakes: Geological Society of America Bulletin, v. 95, no. 4, p. 406-421.
Lettis, W.R., and Hall, N.T., 1994, Los Osos fault zone, San Luis Obispo County, California, in Alterman, I.B., McMullen, R.B., Cluff, L.S., and Slemmons, D.B., eds., Seismotectonics of the Central California coast ranges, Geological Society of America Special Paper 292, p. 73-102.
Martin, G.R., and Lew, M., 1999, Recommended procedures for implementation of DMG Special Publication 117, Guidelines for analyzing and mitigating liquefaction hazards in California: Southern California Earthquake Center, 63 p.
McGuire, R.K., 1995, Probabilistic seismic hazard analysis and design earthquakes: Closing the loop: Seismological Society of America Bulletin, v. 85, no. 5, p. 1275-1284.
Mitchell, J.K., Masood, T., Kayen, R.E., and Seed, R.B., 1990, Soil conditions and earthquake hazard mitigation in the Marina District of San Francisco: University of California, Earthquake Engineering Research Center, Report No. UCB-EERC-90/08 UCB-EERC-90/08, 59p.
Mitchell, J.K., and Wentz, F.J., Jr., 1998, Improved-ground performance during the earthquake, in Holzer, T.L., ed., The Loma Prieta, California, earthquake of October 17, 1989 - Liquefaction, U. S. Geological Survey Professional Paper 1551-B, p. B241-B272.
Noce, T.E., and Holzer, T.L., 2003, Subsurface exploration with the cone penetration testing truck U.S. Geological Survey Fact Sheet 028-03 (http://geopubs.wr.usgs.gov/fact-sheet/fs028-03/).
O'Rourke, T.D., ed., 1992, The Loma Prieta, California, earthquake of October 17, 1989 - Marina District: Strong ground motion and ground failure, U. S. Geological Survey Professional Paper 1551-F, 215 p.
Petersen, M.D., Bryant, W.A., Cramer, C.H., Cao, T., Reichle, M., Frankel, A.D., Lienkaemper, J.J., McCrory, P.A., and Schwartz, D.P., 1996, Probabilistic seismic hazard assessment for the state of California: California Geological Survey Open-file Report 96-706.
Port and Harbour Research Institute, ed., 1997, Handbook on liquefaction remediation of reclaimed land: Rotterdam, A.A. Balkema, 312 p.
Robertson, P.K., and Wride, C.E., 1997, Cyclic liquefaction and its evaluation based on the SPT and CPT, in Youd, T.L., and Idriss, I.M., eds., Evaluation of liquefaction resistance of soils: National Center for Earthquake Engineering Research Technical Report NCEER-97-0022, p. 41-87.
Seed, H.B., and Idriss, I.M., 1971, Simplified procedure for evaluating soil liquefaction potential: American Society of Civil Engineers Journal of Soil Mechanics and Foundation Engineering, v. 97, no. 9, p. 1249-1273.
Seed, H.B., III, Tokimatsu, K., Harder, L.F., and Chung, R.M., 1985, Influence of SPT procedures in soil liquefaction resistance evaluations: American Society of Civil Engineers Journal of Geotechnical Engineering, v. 111, no. 12, p. 1425-1445.
Toprak, S., and Holzer, T.L., 2003, Liquefaction potential index: Field assessment: Journal of Geotechnical and Geoenvironmental Engineering, v. 129, no. 4, p. 315-322.
UBC, 1997, Uniform building code: Whittier, CA, International Conference of Building Officials.
Wald, D.A., Quitoriano, V., Heaton, T.H., and Kanamori, H., 1999, Relationship between peak ground acceleration, peak ground velocity, and modified Mercalli intensity in California: Earthquake Spectra, v. 15, no. 3, p. 557-564.
Weber, E.N., and Hanamura, F.T., 1970, Sea-water intrusion: Pismo-Guadalupe area: California Department of Water Resources Bulletin 63-3, 76 p.
Youd, T.L., and Bennett, M.J., 1983, Liquefaction sites, Imperial Valley, California: American Society of Civil Engineers Journal of Geotechnical Engineering, v. 109, no. 3, p. 440-457.
Youd, T.L., Hansen, C.M., and Bartlett, S.F., 1999, Revised MLR equations for predicting lateral spread displacement, in Seventh U.S.-Japan workshop on earthquake resistant design of lifeline facilities and countermeasures against liquefaction, Seattle, Multidisciplinary Center for Earthquake Engineering, p. 99-114.
Youd, T.L., and Perkins, D.M., 1978, Mapping liquefaction-induced ground failure potential: American Society of Civil Engineers Journal of Geotechnical Engineering, v. 104, no. 4, p. 433-446.
Interview with Pat Cardoza conducted on January 5, 2004
Interviewer: Thomas L. Holzer, USGS
Pat Cardoza: After the shaking stopped, I would say about 5 to 10 minutes after the shaking stopped, water started just spouting up out of the ground at different places. I was over here in the driveway and little cracks occurred and water started seeping and within a few minutes it was just pushing up, probably 18 inches high, just spouting out water, sometimes as much as I would say about 1200 gallons per minute in the larger areas, just bubbling out.
Tom Holzer: Did it surge or flow continuously?
Pat Cardoza: It continuously flowed, it just started out slow and continuously got bigger. It stayed a pretty good flow for probably 15 minutes or so before it started going back. From the time it started to the time it finished was probably about a half an hour. It just slowly went down and stopped again. Yeah, some of the cracks out there were pumping, you know, some of them were smaller ones that were just bubbling you know small streams of water. Most of them were pretty good streams of water probably in the 100’s of gallons per minute. Like I say, there was a couple of bigger ones out there that were probably close to 1200 gallons per minute. It was shooting water a good 18 inches high out of the ground.
Tom Holzer: Was the water muddy or clear?
Pat Cardoza: Yeah, it was muddy. A lot of the places where you see the color of the sand, it was black. It was real dark gray and black.
Download this report as a PDF document (15.1 MB)
For questions about the content of this report, contact Tom Holzer
| Help
| PDF help
| Publications main page | Open-File
Reports for 2004 |