
USGS Open-file Report 04-1302
Version 1.0
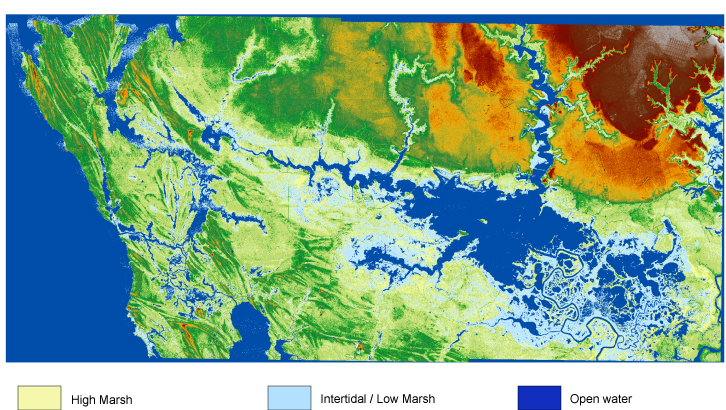
Figure 2. LIDAR image of the Blackwater NWR (March 25, 2002; contour interval 30 cm; datum NAVD 88)
The areas of intertidal and high marsh vegetation zones are deleniated on the map based on elevations of MHW and MLW. This detailed topo-map shows that practically all of the area of the Blackwater NWR is fairly flat, with highest elevations of approximately 1 — 1.5 m. Elevations increase up to 5 m to the north-east of the Blackwater NWR.
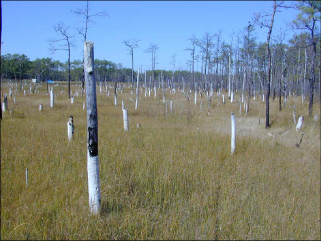
Figure 2a.
The manner in which marsh surface is inundated by the rising sea level depends on the gradient of the adjacent slopes. In the eastern part of the Blackwater NWR, elevations increase very gradually as is shown by the LIDAR model. At present, rising sea level causes an expansion of open water along with a slow retreat of marsh vegetation zones up the slope in this part of the Refuge. On the contrary, the western part of the Refuge is characterized by higher elevation gradients and presence of numerous relict beach ridges. Ridges are often wooded with loblolly pines being the dominant species. Intertidal and high marsh zones are narrower in this part of the Refuge. As the sea level rises, these vegetation zones are pushed against slope gradients that prohibit smooth transition of the marsh surface upland. Forested areas become continuously inundated by water. Trees at the edge of the upland die and form a transition zone between the marsh surface and wooded areas that run along the highest parts of the relict beach ridges.
[an error occurred while processing this directive]