Discussion
 |
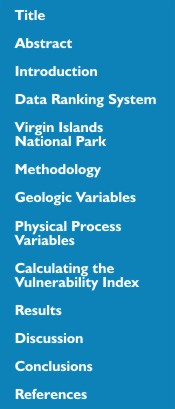
| Figure 11. Relative Coastal Vulnerability for Virgin Islands National Park. Click on figure for larger image. |
The data within the coastal vulnerability index (CVI) show variability at different spatial scales. However, the ranked values for the physical process variables vary less over the extent of the shoreline. The value of the relative sea-level rise variable is constant at very low vulnerability for the entire study area. The significant wave height vulnerability is moderate to very high. The tidal range is very high vulnerability (< 1m) for all of St. John.
 |
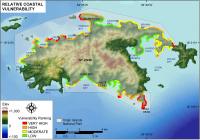
| Figure 4. Coastal Geomorphology for Virgin Islands National Park. Click on figure for larger image. |
The geologic variables show the most spatial variability and thus have the most influence on CVI variability (Figure 11). Geomorphology in the park includes very high vulnerability sandy beach shoreline, high vulnerability gravel beaches, moderate vulnerability alluvium or cliffs with fringing reefs, and low vulnerability rock and cliff features (Figure 4 and Figure 5 A-H).
Vulnerability assessment based on shoreline change remains constant at moderate vulnerability for all of Virgin Islands NP (Figure 6). Regional coastal slope is in the very low to very high vulnerability range for Virgin Islands.
 |
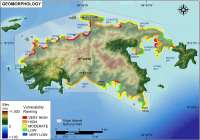
| Figure 5 A-H. Photos of different geomorphology types within Virgin Islands National Park. Click on figure for larger image. |
The most influential variables in the CVI are geomorphology, coastal slope, and wave energy; therefore they may be considered the dominant factors controlling how Virgin Islands National Park will evolve as sea level rises.
Back to Top