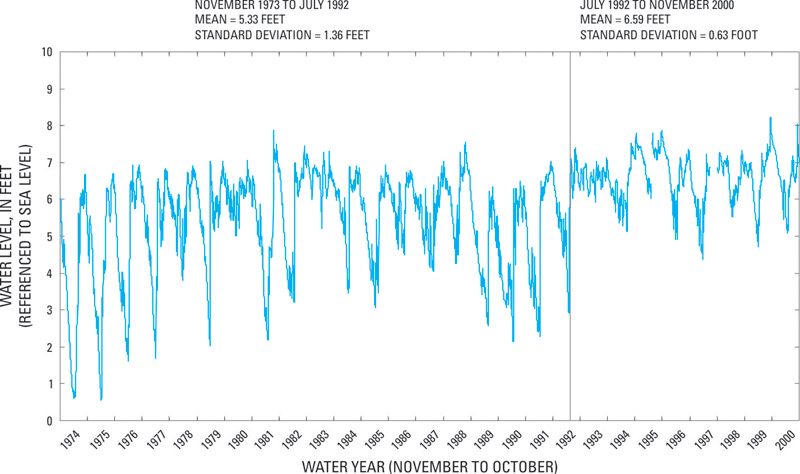
Figure 6.
Hydrograph showing variation in water level at well
G-1502
during water years 1974-2000.
close window