USGS Open-File Report 2004-1443, Operation Manual: Time-Series, Storm-Activated Suspended Sediment Sampler Deployed in the Coastal Ocean
Appendix 3.
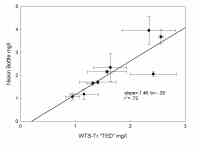
Results comparing the suspended matter concentrations collected with the WTS-Tr instruments (designated BOB and TED) with those of the Niskin bottle are shown in Table 2. Scatter plots were constructed showing the linear relationship between the two sets of mean values for all test dates. A high positive correlation (r²= 0.98) exists between the mean suspended matter concentrations (n=6 data pairs) collected by the WTS-Tr BOB system and the Niskin bottle (Figure 8A). There is considerable variability of suspended matter concentrations as shown by the standard deviations plotted as error bars (Figure 8A). Suspended matter concentrations determined with the WTS-Tr BOB were, on average, 21 % lower than those determined by the Niskin bottle. Data and plots comparing WTS-Tr TED with the Niskin bottle were similar. The linear correlation coefficient (r²= 0.72) was high between the mean suspended matter concentrations (n=9 data pairs) collected by the WTS-Tr TED and Niskin bottle system (Figure 8B) and, on average, the concentrations determined with WTS-Tr TED were 23% lower than those determined using the Niskin bottle. There are a number of possible reasons why the WTS systems give lower results than the Niskin bottle system and why both systems have considerable variability. We suspect that the lower suspended matter concentrations determined using the WTS systems indicates that the tubing, connectors, and filter holder upstream of the filter remove some particulates. In contrast, the Niskin bottle has no tubing and the Millipore vacuum filter apparatus has no connectors above the filter and smooth glass surfaces that are easily rinsed. Based on microscopic analysis, the suspended particulates collected from these tidally mixed surface water contained filamentous organic matter, living plankton, and sometimes gelatinous masses, which may have been partially trapped along the flow path of the WTS system.
The variability of results obtained in dock tests could be due to the dynamic conditions at the site. During some of the tests, tidal currents were in the range of 50-100 cm/sec and considerable turbulence was observed around support pilings. Variable concentration and composition of suspend sediment would not be unusual over short time scales under these conditions although a continuously recording optical sensor was not used to confirm this assumption. The WTS and Niskin systems may have sampled different turbulent eddies within the flowing water. Although both are triggered at the same depth and at the same time, the WTS pumps for about 5 minutes with individual samples separated by at least 10 minutes. The Niskin bottle encloses its sample of water in a fraction of a second. Hence, the samples collected by the two systems are measuring variability in the flowing water mass on different time scales. Another possible cause of the difference between systems and the variability in results of the WTS is the behavior of flow entering a downward looking intake port and whether the intake port is upstream or downstream of other structures on the instrument. Flow into the intake is not isokinetic, meaning that flow does not enter the port at the same speed and direction as the ambient current (Webb and Radtke, 2003). A somewhat related issue is that the intake port could have been on the upstream side of the instrument and in less local turbulence during some pumping events and down stream of the instrument in greater local turbulence during others. The impact of the non-isokinetic nature of the intake port, and its behavior in different local turbulence, could not be evaluated. A port that always points into the current, as described by Sternberg et al. (1986), may be an advantage that should be explored in future tests. As mentioned elsewhere in this report, the dock offers the advantages of depth (greater overpressure) and convenient capability for deploying and recovering the samplers. The disadvantage of this test site is the variability in oceanographic conditions. Future tests should be conducted in a test tank that is 30 feet deep and has the capability for complete mixing of suspended matter of selected composition and concentration. |