USGS Open-File Report 2004-1443, Operation Manual: Time-Series, Storm-Activated Suspended Sediment Sampler Deployed in the Coastal Ocean
Appendix 6Preliminary comparisons of the WTS-P and other sampling/filtration methods:
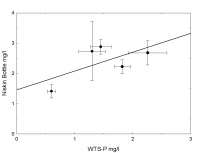
Two approaches were used to evaluate the sampling efficiency of the WTS-P unit. The first involved tests at the WHOI dock at a depth of 30 feet where the WTS-P system was compared to a conventional Niskin bottle and Millipore vacuum system as discussed earlier. The second approach, conducted in the laboratory, evaluated the performance of the WTS-P in response to changes in particle sizes and flow rates through the sampler. Results of the tests at the dock showed that suspended matter concentrations determined with the WTS-P system were 62% on average of those measured with the Niskin bottle (Table 3). There was a considerable amount of variability in suspended matter concentrations in samples collected a few minutes apart and only a fair correlation when results of one method were plotted against the other (Figure 11, r² = 0.42). As discussed in a previous section, there are several possible reasons for the discrepancy and the variability. High tidal current velocities at the dock may result in non-uniform suspended matter concentrations over short time scales. The natural assemblage of particulate surface water at the dock is likely to include filamentous organic particles (i.e. living plankton) that may be preferentially trapped in the small orifices and tubing of the WTS-P instrument before reaching the filter. The intake port fixed to the WTS-P instrument package was not consistently oriented with respect to current direction. A difference in efficiency of drawing particles into a tube from the upstream side or from the more turbulent downstream side of the instrument is suspected but has not been evaluated. The second series of tests were preformed in the laboratory where the suspended matter composition and concentration could be controlled. The laboratory tests were conducted using material collected from a near-bottom sediment trap in Massachusetts Bay. This material was sieved through a 1000-micron screen to remove juvenile clams that had set on the trap surfaces. The sieved material consisted of 10% sand (made up largely of thin carbonate fragments), 40% silt, and 50% clay. The fine grained, high carbonate and organic-rich sediment probably more closely simulates the suspended sediment encountered by the WTS-P during a deployment in Massachusetts Bay than the material suspended in near surface water at the dock. A suspension of trap material was prepared in a 16-liter supply bucket and kept well mixed by a mechanical stirrer. Two siphon tubes were fixed in the center of the supply bucket. One tube directed suspension through the manifold, tubing and connectors of the WTS-P (without a filter) to a collection beaker. The other tube emptied directly to a beaker. The test was designed to evaluate the potential losses of particles as the suspension flowed through the plumbing of the WTS-P. The flow rates were 100 ml/min and about 50 ml/min, controlled by adjusting the hydraulic head between supply bucket and collection beaker. The higher rate is close to the starting pumping speed of 125 ml/min, and the lower rate is the limit at which pumping is turned off. Suspended matter concentrations on all samples were determined by filtering a known volume of sample through a pre-weighed Nuclepore filter (0.4 micron pore diameter) in a Millipore vacuum filtration system. The concentrations of suspended sediment trap material collected through the WTS-P and through the straight tube were essentially identical at both the high and the low flow rate (Table 4). These results indicated that the sediment trap material was not removed by the internal plumbing of the WTS-P. Other tests were conducted using a suspension of surficial bottom sediment from the continental shelf consisting of 7% very fine sand (made up largely of lithogenic particles), 67% silt, and 26% clay. The suspended matter concentrations determined on the suspension flowing through the WTS-P were on average 88% of the value flowing through the siphon tube at a flow rate of 125 ml/min and 71% at a flow rate at 50 ml/ min. Additional tests used a suspension of very fine sand (6.25-125 micron) sieved from a local beach. The concentration of sand suspension flowing through the WTS-P was 29% of the concentration passing through the siphon tube at a flow rate of 125 ml/min. It is worth noting that the very fine sand (62.5-125 micron) is not representative of natural sediment. It was used to test the flow-through of the coarser grain sizes.) These observations indicate a significant under sampling of lithogenic particles as the particle grain size increases. The cause for this under sampling this sediment type is not obvious. The minimum speed of the suspension passing through the WTS-P is greater than 9 cm/sec (at 50-ml/min-flow rate) which is 10 times higher than the settling velocity of a quartz grain having diameter 0.125 mm (fine sand). An accumulation of coarse grains has never been apparent at the junction of connectors. To evaluate this issue further, additional testing is required using higher pumping rates and filters with higher permeability. Ideally, these tests should be performed in a tank in which overpressures equivalent to 30 feet water depth (about 1 atmosphere). This overpressure prevents the cavitation when the pump draws a negative pressure as filters become clogged. The other important feature of any test tank is the capability for maintaining a well-mixed suspension of known composition and concentration.
| |||

|