USGS visual identity mark and link to main Web site at http://www.usgs.gov/

Digital Mapping Techniques '04— Workshop Proceedings
U.S. Geological Survey Open-File Report 2004–1451

Process of Converting Geologic Maps from Coverages to Geodatabases

By Karen Wheeler, Philip Dinterman, Russell Evarts, and Ray Wells

U.S. Geological Survey, Western Earth Surface Processes Team, 345 Middlefield Rd., MS-973, Menlo Park, CA 94025; Telephone: (650) 329-4935; Fax: (650) 329-4936; e-mail: kwheeler@usgs.gov

INTRODUCTION

The Pacific Northwest Urban Corridor Geologic Mapping project is providing digital 1:24000-scale geologic mapping of areas in western Oregon and Washington. Our databases are online, with documentation describing the datasets at http://geology.wr.usgs.gov/wgmt/pacnw/.

Online releases from 1995–2002 include:

  1. Database package—ArcInfo coverage export (.e00), grids, AMLs, symbolsets, readme, and metadata
  2. PostScript package—Encapsulated PostScript files for printing
  3. PDF package—Adobe Acrobat PDF files for viewing and printing.

In 2002, we began using ArcGIS for database management and map creation. The data structure for our databases followed the Alacarte standard (Fitzgibbon, 1991; Fitzgibbon and Wentworth, 1991; Wentworth and Fitzgibbon, 1991).

Our project has converted almost all our pre-existing coverages from Workstation ArcInfo to ArcGIS geodatabases.

Current packages produced for the website include:

  1. PDFs of the geology map and pamphlet
  2. Geodatabase, metadata, and ArcMap document for viewing and querying
  3. Shapefiles exported from Geodatabase.

We now are adding more data to our geodatabases, improving our collection of data with ArcPad, developing styles for ArcMap which make the maps more uniform, streamlining the map production with templates, and improving our metadata. A downloadable PDF of our DMT ’04 poster is available at http://ngmdb.usgs.gov/Info/dmt/docs/wheeler04.pdf(15MB).

CONVERTING COVERAGES TO GEODATABASES

A typical conversion of one geology map from coverages to a Geodatabase takes about 10 minutes or less.

1. Use ArcCatalog to create a Personal Geodatabase

  1. Specify a New Personal Geodatabase (Figure 1a).
  2. Add Feature Datasets such as geology, locations, and structure (Figure 1b).
  3. Create a Feature Class in that Feature Dataset or import coverages into a Feature Dataset as Feature Classes (Figure 1c).
  4. If desired, specify Domains for tagging in ArcMap (Figure 1d). A Domain is the range of values allowed for a column in a database.
Open ArcCatalog and create a Personal Geodatabase. Rename the geodatabase with a name that you or your organization prefers. For a more detailed explanation, contact Karen Wheeler at kwheeler@usgs.gov. 
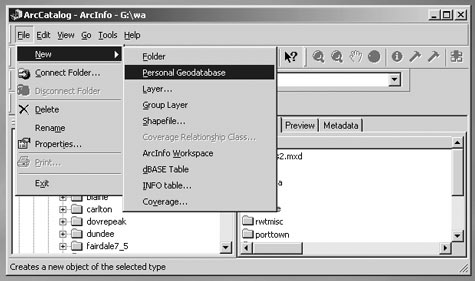
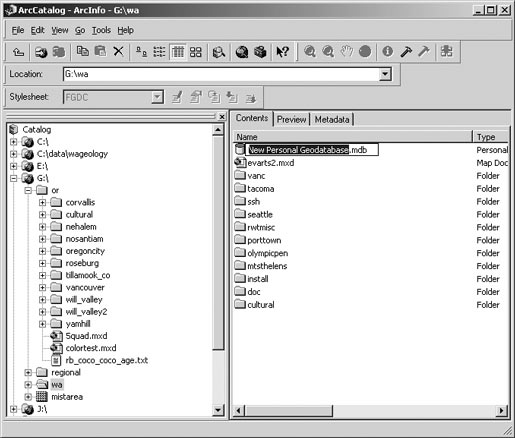
Figure 1a. Open ArcCatalog and create a Personal Geodatabase. Rename the geodatabase with a name that you or your organization prefers.
Open ArcCatalog and create a Personal Geodatabase. Rename the geodatabase with a name that you or your organization prefers. For a more detailed explanation, contact Karen Wheeler at kwheeler@usgs.gov.

Add Feature Datasets (such as geology, locations, and structure) in ArcCatalog. Create a Feature Dataset in that geodatabase (right click the name of the geodatabase). Name the Feature Dataset and click the Edit button to choose a projection. For a more detailed explanation, contact Karen Wheeler at kwheeler@usgs.gov. 
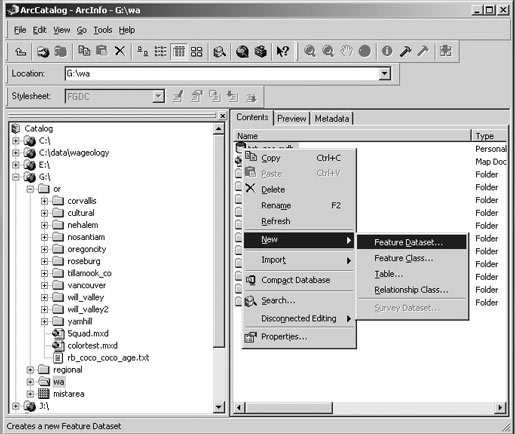
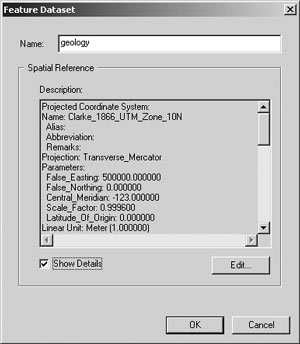
Figure 1b. Add Feature Datasets (such as geology, locations, and structure) in ArcCatalog. Create a Feature Dataset in that geodatabase (right click the name of the geodatabase). Name the Feature Dataset and click the Edit button to choose a projection.
Add Feature Datasets (such as geology, locations, and structure) in ArcCatalog. Create a Feature Dataset in that geodatabase (right click the name of the geodatabase). Name the Feature Dataset and click the Edit button to choose a projection. For a more detailed explanation, contact Karen Wheeler at kwheeler@usgs.gov.  

Create a Feature Class in that Feature Dataset or import coverages into the Feature Dataset as Feature Classes in ArcCatalog (right click the name of the dataset). Type in the Name of the new Feature Class, then click which Type of Feature Class, and click Next button. Or you might import preexisting coverages or shapefiles to the Feature Dataset as Feature Classes. For a more detailed explanation, contact Karen Wheeler at kwheeler@usgs.gov. 
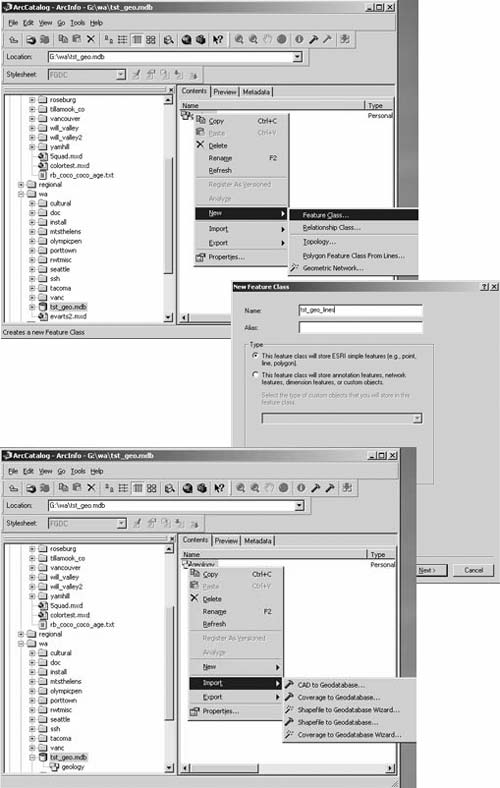
Figure 1c. Create a Feature Class in that Feature Dataset or import coverages into the Feature Dataset as Feature Classes in ArcCatalog (right click the name of the dataset). Type in the Name of the new Feature Class, then click which Type of Feature Class, and click Next button. Or you might import preexisting coverages or shapefiles to the Feature Dataset as Feature Classes.

Use ArcCatalog to specify Domains for the Geodatabase which will later be attribute choices in Arcmap as features are attributed. To create Domains, start ArcCatalog. Right-click on your previously created Geodatabase and select Properties (see top left group of images). Type in a new Domain Name (e.g., 'water_body'). Click the field to the right of Field Type and select a type (such as Text). Enter the Coded Values with Description for your tags. Click Apply and OK, and exit from ArcCatalog. Start ArcMap, open a Map Document, which has the geologic data in it, or add the data to it (see top right group of images, and Figures 2a and 2b). Right click the Feature Class to link the Domain, and click Open Attribute Table. On the Attribute Table, click the Options button, and select Add Field. Type in the Name of the new field (e.g., 'water'). Click the drop arrow to right of Type and select Text. Click to right of Domain and select the Domain previously created in ArcCatalog. Click OK. The attribute table will now have the new field in it, appended at the end (see image in the second row). Save ArcMap, and start an Edit Session (see left image in third row). Click in a record to tag, select a tag from the drop menu, and tag feature (e.g., as 'lake'; see right image in third row). Save edits (see image at bottom). Save ArcMap Document. For a more detailed explanation, contact Karen Wheeler at kwheeler@usgs.gov. 
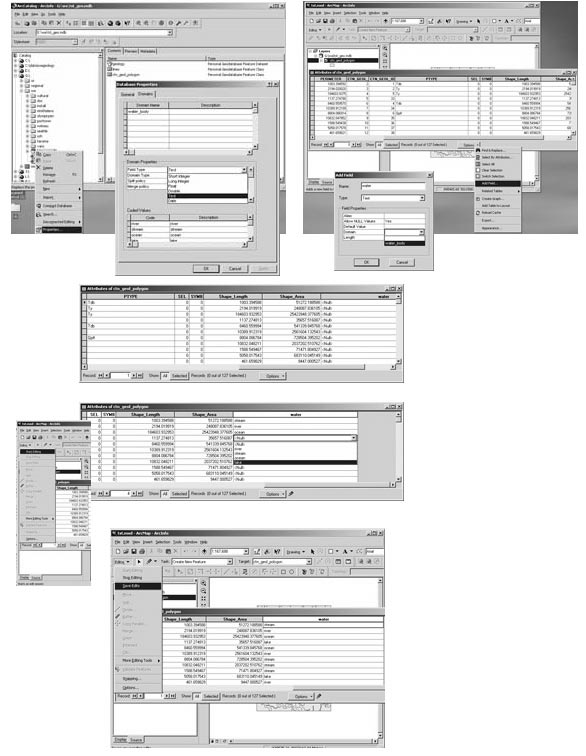
Figure 1d. Use ArcCatalog to specify Domains for the Geodatabase which will later be attribute choices in Arcmap as features are attributed. To create Domains, start ArcCatalog. Right-click on your previously created Geodatabase and select Properties (see top left group of images). Type in a new Domain Name (e.g., 'water_body'). Click the field to the right of Field Type and select a type (such as Text). Enter the Coded Values with Description for your tags. Click Apply and OK, and exit from ArcCatalog. Start ArcMap, open a Map Document, which has the geologic data in it, or add the data to it (see top right group of images, and Figures 2a and 2b). Right click the Feature Class to link the Domain, and click Open Attribute Table. On the Attribute Table, click the Options button, and select Add Field. Type in the Name of the new field (e.g., 'water'). Click the drop arrow to right of Type and select Text. Click to right of Domain and select the Domain previously created in ArcCatalog. Click OK. The attribute table will now have the new field in it, appended at the end (see image in the second row). Save ArcMap, and start an Edit Session (see left image in third row). Click in a record to tag, select a tag from the drop menu, and tag feature (e.g., as 'lake'; see right image in third row). Save edits (see image at bottom). Save ArcMap Document.

2. Use ArcMap to symbolize a Geologic Map of the Geodatabase

  1. Create a new Map Document (Figure 2a).
  2. Add data from newly created geodatabase (Figure 2b).
  3. Use Styles or a previous Layer file for symbology (Figure 2c).
Create a new Map Document in ArcMap. Open ArcMap and create a New Map Document. Right click the Layers in the Table of Contents frame, and specify the Coordinate System, and scale. For a more detailed explanation, contact Karen Wheeler at kwheeler@usgs.gov. 
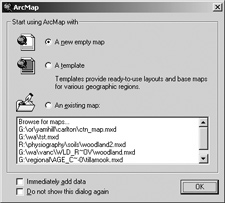
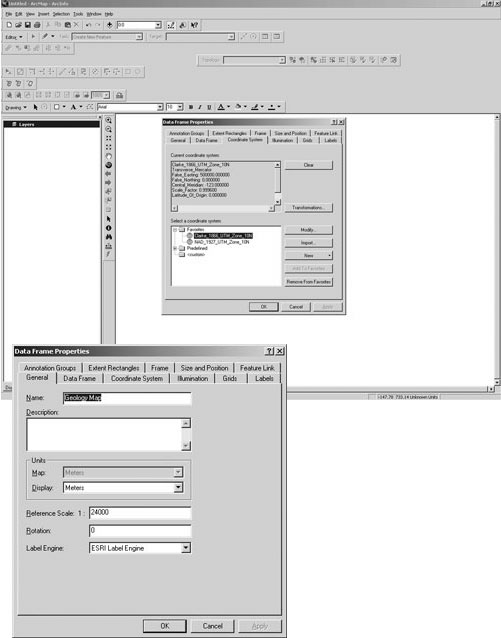
Figure 2a. Create a new Map Document in ArcMap. Open ArcMap and create a New Map Document. Right click the Layers in the Table of Contents frame, and specify the Coordinate System, and scale.
Create a new Map Document in ArcMap. Open ArcMap and create a New Map Document. Right click the Layers in the Table of Contents frame, and specify the Coordinate System, and scale. For a more detailed explanation, contact Karen Wheeler at kwheeler@usgs.gov.

Add data from newly created geodatabase in ArcMap. Add data (the yellow button with plus symbol), and select the Geodatabase previously created with Dataset (see two images in top row). It plots with default symbols (see middle image), but you can easily change that with a lookup table (see bottom image), with a style, or by specifying each one individually in the Layer Properties is greater than Symbology tab. For a more detailed explanation, contact Karen Wheeler at kwheeler@usgs.gov. Add data from newly created geodatabase in ArcMap. Add data (the yellow button with plus symbol), and select the Geodatabase previously created with Dataset (see two images in top row). It plots with default symbols (see middle image), but you can easily change that with a lookup table (see bottom image), with a style, or by specifying each one individually in the Layer Properties is greater than Symbology tab. For a more detailed explanation, contact Karen Wheeler at kwheeler@usgs.gov. 
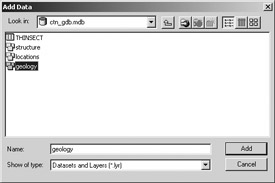
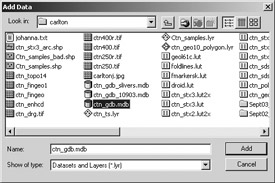
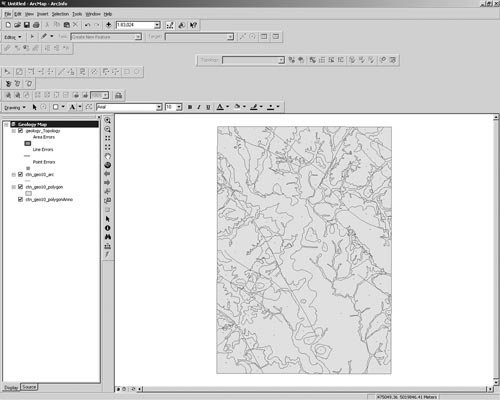
Figure 2b. Add data from newly created geodatabase in ArcMap. Add data (the yellow button with plus symbol), and select the Geodatabase previously created with Dataset (see two images in top row). It plots with default symbols (see middle image), but you can easily change that with a lookup table (see bottom image), with a style, or by specifying each one individually in the Layer Properties > Symbology tab.
Add data from newly created geodatabase in ArcMap. Add data (the yellow button with plus symbol), and select the Geodatabase previously created with Dataset (see two images in top row). It plots with default symbols (see middle image), but you can easily change that with a lookup table (see bottom image), with a style, or by specifying each one individually in the Layer Properties is greater than Symbology tab. For a more detailed explanation, contact Karen Wheeler at kwheeler@usgs.gov.  
Add data from newly created geodatabase in ArcMap. Add data (the yellow button with plus symbol), and select the Geodatabase previously created with Dataset (see two images in top row). It plots with default symbols (see middle image), but you can easily change that with a lookup table (see bottom image), with a style, or by specifying each one individually in the Layer Properties is greater than Symbology tab. For a more detailed explanation, contact Karen Wheeler at kwheeler@usgs.gov.

Use Styles or a previous Layer file for symbology in ArcMap. To symbolize with the Lookup Table, join the table to the polygons (top left image). Bring up the Layer Properties for the Polygons, Symbology Tab (top right image), and choose 'Categories greater than Match Symbols in a Style'. Select Value field, then the Style, and click the Match Symbols button (middle image). Styles are edited using the Style Manager in ArcMap, and may be shared among ArcGIS desktop users. Select 'Tools greater than Styles greater than Style Manager' to chose a Style that you've received from another ArcGIS user. Right click on the Name, copy and paste, edit new symbol by Properties. The bottom image shows lines symbolized with a style, not a lookup table. For a more detailed explanation, contact Karen Wheeler at kwheeler@usgs.gov. Use Styles or a previous Layer file for symbology in ArcMap. To symbolize with the Lookup Table, join the table to the polygons (top left image). Bring up the Layer Properties for the Polygons, Symbology Tab (top right image), and choose 'Categories greater than Match Symbols in a Style'. Select Value field, then the Style, and click the Match Symbols button (middle image). Styles are edited using the Style Manager in ArcMap, and may be shared among ArcGIS desktop users. Select 'Tools greater than Styles greater than Style Manager' to chose a Style that you've received from another ArcGIS user. Right click on the Name, copy and paste, edit new symbol by Properties. The bottom image shows lines symbolized with a style, not a lookup table. For a more detailed explanation, contact Karen Wheeler at kwheeler@usgs.gov.


Use Styles or a previous Layer file for symbology in ArcMap. To symbolize with the Lookup Table, join the table to the polygons (top left image). Bring up the Layer Properties for the Polygons, Symbology Tab (top right image), and choose 'Categories greater than Match Symbols in a Style'. Select Value field, then the Style, and click the Match Symbols button (middle image). Styles are edited using the Style Manager in ArcMap, and may be shared among ArcGIS desktop users. Select 'Tools greater than Styles greater than Style Manager' to chose a Style that you’ve received from another ArcGIS user. Right click on the Name, copy and paste, edit new symbol by Properties. The bottom image shows lines symbolized with a style, not a lookup table. For a more detailed explanation, contact Karen Wheeler at kwheeler@usgs.gov.
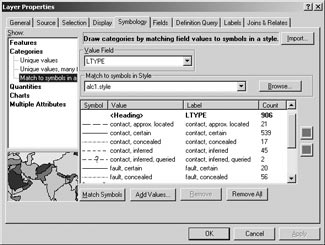
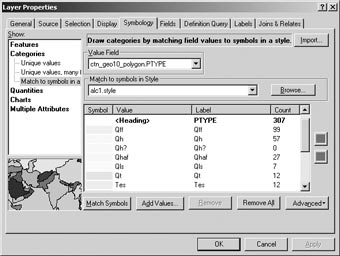
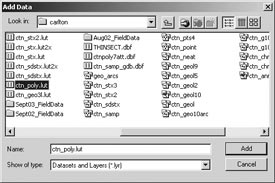
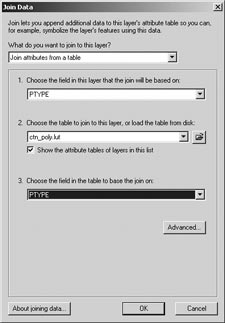
Figure 2c. Use Styles or a previous Layer file for symbology in ArcMap. To symbolize with the Lookup Table, join the table to the polygons (top left image). Bring up the Layer Properties for the Polygons, Symbology Tab (top right image), and choose “Categories > Match Symbols in a Style”. Select Value field, then the Style, and click the Match Symbols button (middle image). Styles are edited using the Style Manager in ArcMap, and may be shared among ArcGIS desktop users. Select “Tools > Styles > Style Manager” to chose a Style that you’ve received from another ArcGIS user. Right click on the Name, copy and paste, edit new symbol by Properties. The bottom image shows lines symbolized with a style, not a lookup table.
Use Styles or a previous Layer file for symbology in ArcMap. To symbolize with the Lookup Table, join the table to the polygons (top left image). Bring up the Layer Properties for the Polygons, Symbology Tab (top right image), and choose 'Categories greater than Match Symbols in a Style'. Select Value field, then the Style, and click the Match Symbols button (middle image). Styles are edited using the Style Manager in ArcMap, and may be shared among ArcGIS desktop users. Select 'Tools greater than Styles greater than Style Manager' to chose a Style that you've received from another ArcGIS user. Right click on the Name, copy and paste, edit new symbol by Properties. The bottom image shows lines symbolized with a style, not a lookup table. For a more detailed explanation, contact Karen Wheeler at kwheeler@usgs.gov.  

3. Exporting from ArcMap

  1. Export the map at a specified scale, to EPS or to Adobe Illustrator (Figure 2d). Place exported EPS of map in an Illustrator map template for printing.

Export the map from ArcMap, at a specified scale, to EPS or to Adobe Illustrator. In the Data View (top left image), click the Full Extent (Globe button) so that map is zoomed out. Then click the Layout View (second row left image). Click'File greater than Page Setup'. Choose plotter, paper size, and orientation of page (upper right image). Also deselect the Scale map to page size box, or the map will not be a true scale. If the frame of the map is small, click the corner with the arrow tool and drag it to the larger size (bottom row left image). Then specify map scale in the box at the top. Click 'File greater than Export', and name the file for exporting (bottom row right image). From the drop list, choose the type of file (here, Illustrator). Click the Export button. The file will be created, and should open in Adobe Illustrator. If this doesn't work well, try other formats for exporting. For a more detailed explanation, contact Karen Wheeler at kwheeler@usgs.gov. Export the map from ArcMap, at a specified scale, to EPS or to Adobe Illustrator. In the Data View (top left image), click the Full Extent (Globe button) so that map is zoomed out. Then click the Layout View (second row left image). Click'File greater than Page Setup'. Choose plotter, paper size, and orientation of page (upper right image). Also deselect the Scale map to page size box, or the map will not be a true scale. If the frame of the map is small, click the corner with the arrow tool and drag it to the larger size (bottom row left image). Then specify map scale in the box at the top. Click 'File greater than Export', and name the file for exporting (bottom row right image). From the drop list, choose the type of file (here, Illustrator). Click the Export button. The file will be created, and should open in Adobe Illustrator. If this doesn't work well, try other formats for exporting. For a more detailed explanation, contact Karen Wheeler at kwheeler@usgs.gov. 
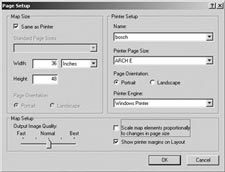
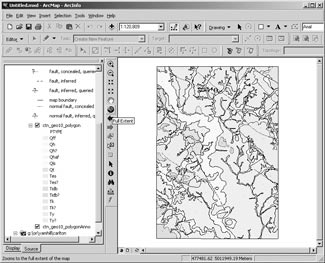
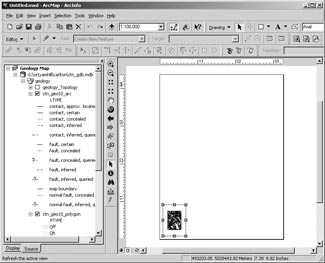
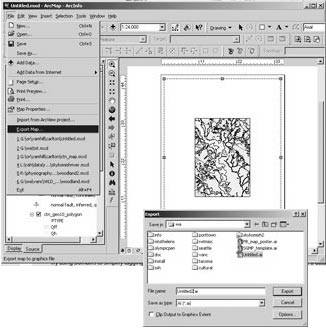
Figure 2d. Export the map from ArcMap, at a specified scale, to EPS or to Adobe Illustrator. In the Data View (top left image), click the Full Extent (Globe button) so that map is zoomed out. Then click the Layout View (second row left image). Click “File > Page Setup”. Choose plotter, paper size, and orientation of page (upper right image). Also deselect the Scale map to page size box, or the map will not be a true scale. If the frame of the map is small, click the corner with the arrow tool and drag it to the larger size (bottom row left image). Then specify map scale in the box at the top. Click “File > Export”, and name the file for exporting (bottom row right image). From the drop list, choose the type of file (here, Illustrator). Click the Export button. The file will be created, and should open in Adobe Illustrator. If this doesn’t work well, try other formats for exporting.
Export the map from ArcMap, at a specified scale, to EPS or to Adobe Illustrator. In the Data View (top left image), click the Full Extent (Globe button) so that map is zoomed out. Then click the Layout View (second row left image). Click 'File greater than Page Setup'. Choose plotter, paper size, and orientation of page (upper right image). Also deselect the Scale map to page size box, or the map will not be a true scale. If the frame of the map is small, click the corner with the arrow tool and drag it to the larger size (bottom row left image). Then specify map scale in the box at the top. Click 'File greater than Export', and name the file for exporting (bottom row right image). From the drop list, choose the type of file (here, Illustrator). Click the Export button. The file will be created, and should open in Adobe Illustrator. If this doesn't work well, try other formats for exporting. For a more detailed explanation, contact Karen Wheeler at kwheeler@usgs.gov.  

PUBLISHED GEODATABASES

Our latest geologic map, published as a geodatabase, was presented on our poster at the Workshop. It was originally compiled on mylar and greenlines, scanned, and digitized into Workstation ArcInfo. It was imported into a Personal Geodatabase, edited in ArcMap, and exported to a graphic file for Illustrator.

Our project’s first geodatabase, Maps showing Inundation depths, ice-rafted erratics, and sedimentary facies of the Late Pleistocene Missoula Floods of the Willamette Valley, Oregon, was published in 2003 and is online at http://geopubs.wr.usgs.gov/open-file/of03-408/. It consists of shapefiles, a geodatabase and metadata, PDFs of maps, and a readme file.

Our most recent geodatabases are best found by visiting our website and clicking the “What’s New” tab or at http://geology.wr.usgs.gov/wgmt/pacnw/new.html. We keep it updated with the latest publications.

FUTURE DIRECTIONS

We are testing ArcPad on an IPAQ-brand Personal Digital Assistant (PDA) with GPS (see paper by Thoms and Haugerud, in these Proceedings). For base maps in ArcPad, we use ArcCatalog to export the DRGs to MrSID compressed-format images. Forms developed in ArcPad are used to collect for each point our data for sample locations, structural measurements, geologic unit, date, time, and also general field notes. Collecting data for points in ArcMap allows us to directly use the information as Shapefiles, and saves time digitizing the points from paper field sheets as was previously done. Once we created a geologic map in ArcGIS, the Geodatabase was exported to ArcPad and used in the field on the IPAQs to add more information; later the file was reimported to the Geodatabase to update the geologic map.

On Windows CE running on Compaq IPAQs, the file navigation software was awkward, so we found it necessary to purchase an inexpensive utility called PE File (HeavenTools software, http://www.heaventools.com/), to better view filename lists with extensions. Our cost has been minimal for these IPAQs and the PE File software.

We are now trying to use ArcSDE for multiuser editing of Geodatabases and for managing large image catalogs, but this is only in the testing phase. It is simple to convert the ArcGIS Personal Geodatabases to ArcSDE databases. We are have migrated from ArcGIS 8.3 to ArcGIS 9, and are adopting a new ArcGIS geologic map database structure and symbolsets.

ADDITIONAL TIPS

REFERENCES

Fitzgibbon, T.T., 1991, ALACARTE installation and system manual (version 1.0): U.S. Geological Survey Open File Report 91–587B, 66 p.

Fitzgibbon, T.T., and Wentworth, C.M., 1991, ALACARTE user interface—AML code and demonstration maps (version 1.0): U.S. Geological Survey Open File Report 91–587A, 10 p.

Wentworth, C.M., and Fitzgibbon, T.T., 1991, ALACARTE user manual (version 1.0): U.S. Geological Survey Open File Report 91–587C, 268 p.


RETURN TO Contents
National Cooperative Geologic Mapping Program | Geology Discipline | Open-File Reports
U.S. Department of the Interior, U.S. Geological Survey
URL: http:// pubsdata.usgs.gov /pubs/of/2004/1451/wheeler/index.html
Maintained by David R. Soller
Last modified: 00:00:05 Sun 13 Jan 2013
Privacy statement | General disclaimer | Accessibility