 |
Coastal Vulnerability Assessment of National Park of American Samoa to Sea-Level Rise
USGS Open-File Report 2005-1055
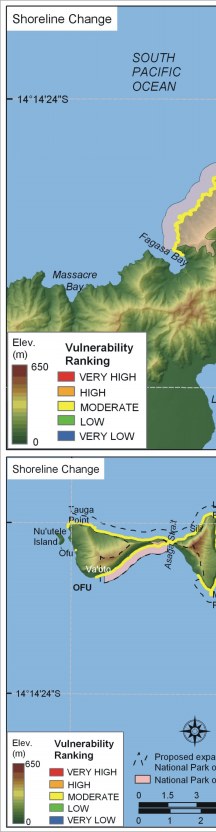
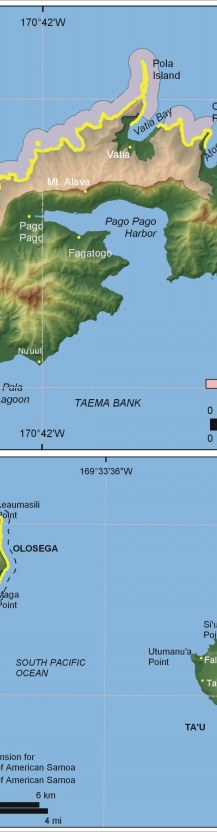
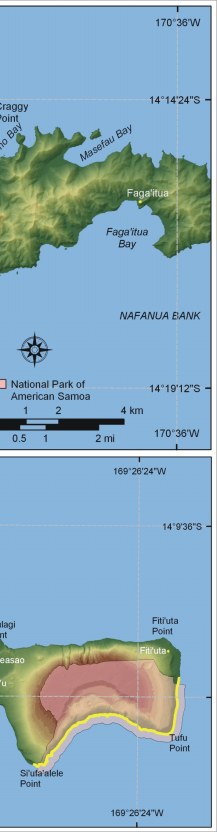
Figure 8. Vulnerability ranking for shoreline change rates for the National Park of American Samoa. The colored shoreline represents the estimated rate of shoreline erosion or accretion. All of National Park of American Samoa is ranked as moderate vulnerability (-1m/yr - +1m/yr) with respect to shoreline change. | ||
 |
 |
 |
 [an error occurred while processing this directive]