Skip past header information
USGS Logo with link to USGS Web page

Coastal Vulnerability Assessment of Channel Islands National Park to Sea-Level Rise, USGS Open-File Report 2005-1057

Back to Title Page

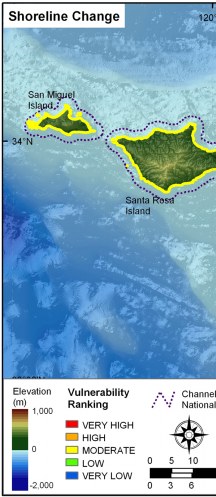
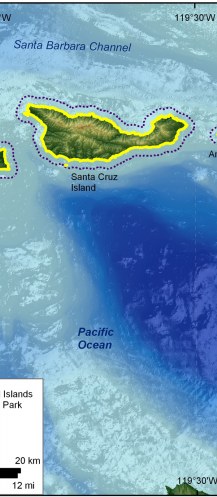
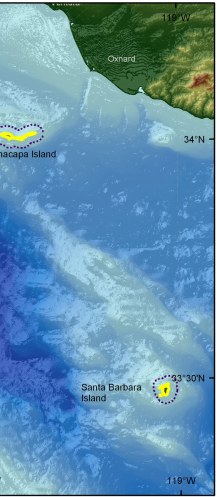
Figure 9. Shoreline change for Channel Islands National Park. The colored shoreline represents the estimated rate of shoreline erosion or accretion. Based on calculated rates for San Miguel Island, all of the Channels Islands were classified as moderate vulnerability.


Figure 9. Shoreline change for Channel Islands National Park. Figure 9. Shoreline change for Channel Islands National Park. Figure 9.  Shoreline change for Channel Islands National Park.

Skip Footer Information

U.S. Department of the Interior, U.S. Geological Survey
URL: http://pubs.usgs.gov/of/2005/1057/html/fig9.html
Maintained by Publishing Services
Last modified: 10:19:18 Wed 06 Jul 2005
Privacy statement | General disclaimer | Accessibility