Back to Title Page
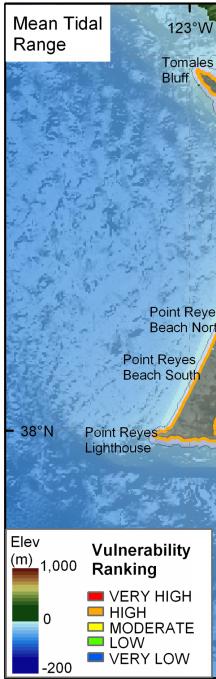
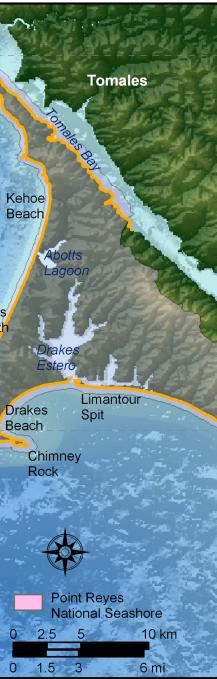
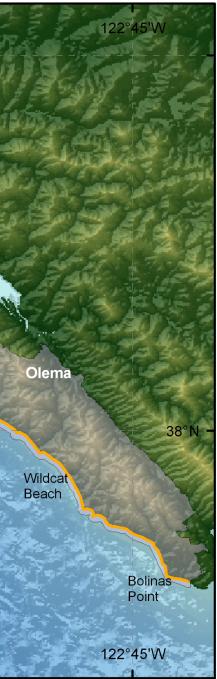
Figure 10. Mean Tidal Range for Point Reyes National Seashore. The colored shoreline represents the vulnerability associated with mean tidal range for Point Reyes. All of Point Reyes is ranked as high vulnerability with respect to tidal range.
U.S. Department of Interior / U.S. Geological Survey
USGS Privacy Statement / Disclaimer / Accessibility URL: http://pubsdata.usgs.gov/pubs/of/2005/1059/html/fig010.htm Maintained by Publication Services Modified Saturday, 12-Jan-2013 21:59:41 EST