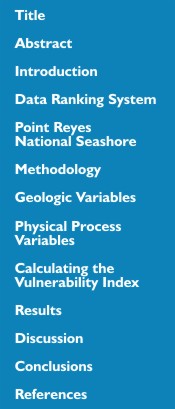
Table 1 shows the six variables described in the Introduction, which include both quantitative and qualitative information. The five quantitative variables are assigned a vulnerability ranking based on their actual values, whereas the non-numerical geomorphology variable is ranked qualitatively according to the relative resistance of a given landform to erosion. Shorelines with erosion/accretion rates between -1.0 and +1.0 m/yr are ranked as being of moderate vulnerability in terms of that particular variable. Increasingly higher erosion or accretion rates are ranked as correspondingly higher or lower vulnerability. Regional coastal slopes range from very high vulnerability, <4.59 percent, to very low vulnerability at values >14.7 percent. The rate of relative sea-level change is ranked using the modern rate of eustatic rise (1.8 mm/yr) as very low vulnerability. Since this is a global or "background" rate common to all shorelines, the sea-level rise ranking reflects primarily local to regional isostatic or tectonic adjustment. Mean wave height contributions to vulnerability range from very low (<1.1 m) to very high (>2.6 m). Tidal range is ranked such that microtidal (<1 m) coasts are very high vulnerability, and macrotidal (>6 m) coasts are very low vulnerability.
Table
1: Ranges for Vulnerability Ranking of Variables on the U.S. Pacific Coast.