Open-File Report 2005-1067
This report has not been reviewed for stratigraphic nomenclature.
Any use of trade, firm, or product names is for descriptive purposes only and does not imply endorsement by the U.S. Government.
|
On January 10, 2005, a landslide struck the community of La Conchita in Ventura County, California, destroying or seriously damaging 36 houses and killing 10 people. This was not the first destructive landslide to damage this community, nor is it likely to be the last. On January 14, 2005, at the invitation of the California Geological Survey, I visited La Conchita with James O'Tousa, contract geologist for Ventura County, and Pamela Irvine, Janis Hernandez, and Terry Jones, all from the California Geological Survey. This report describes my field observations and provides a description of the La Conchita area and its landslide history, a comparison of the 1995 and 2005 landslides, and a discussion of continuing landslide hazards in the La Conchita area.
|
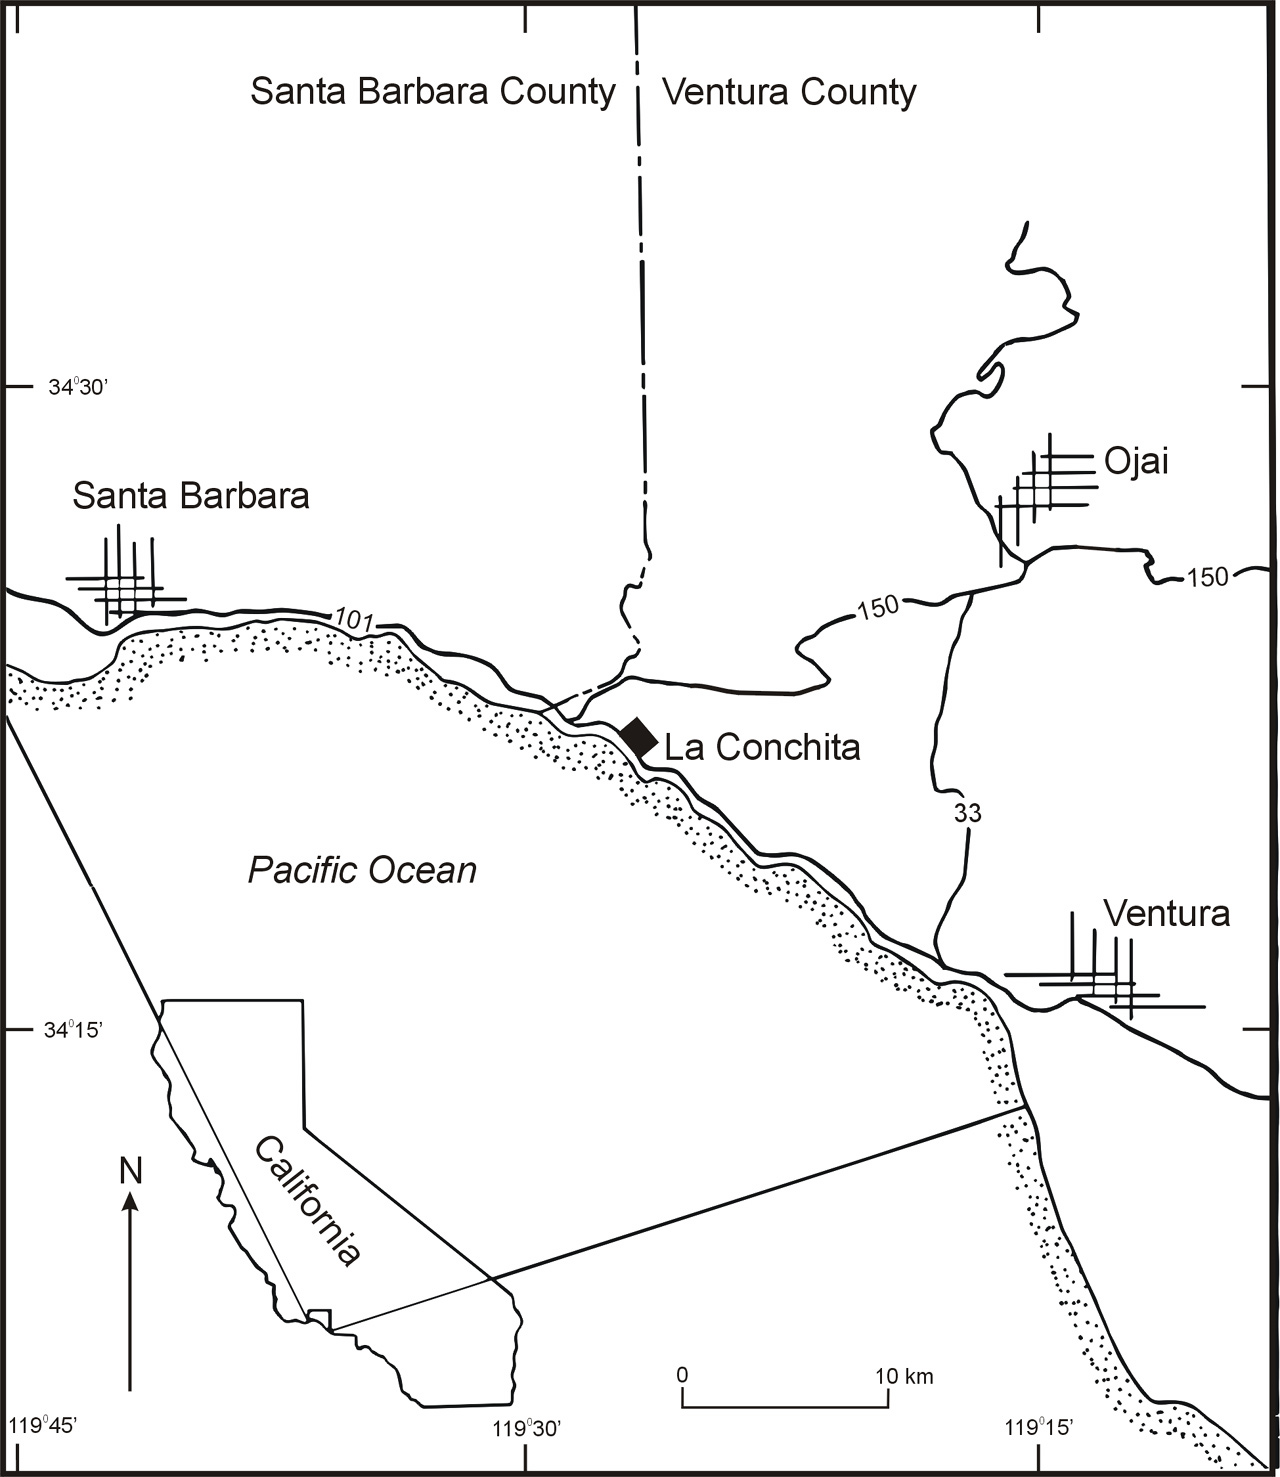
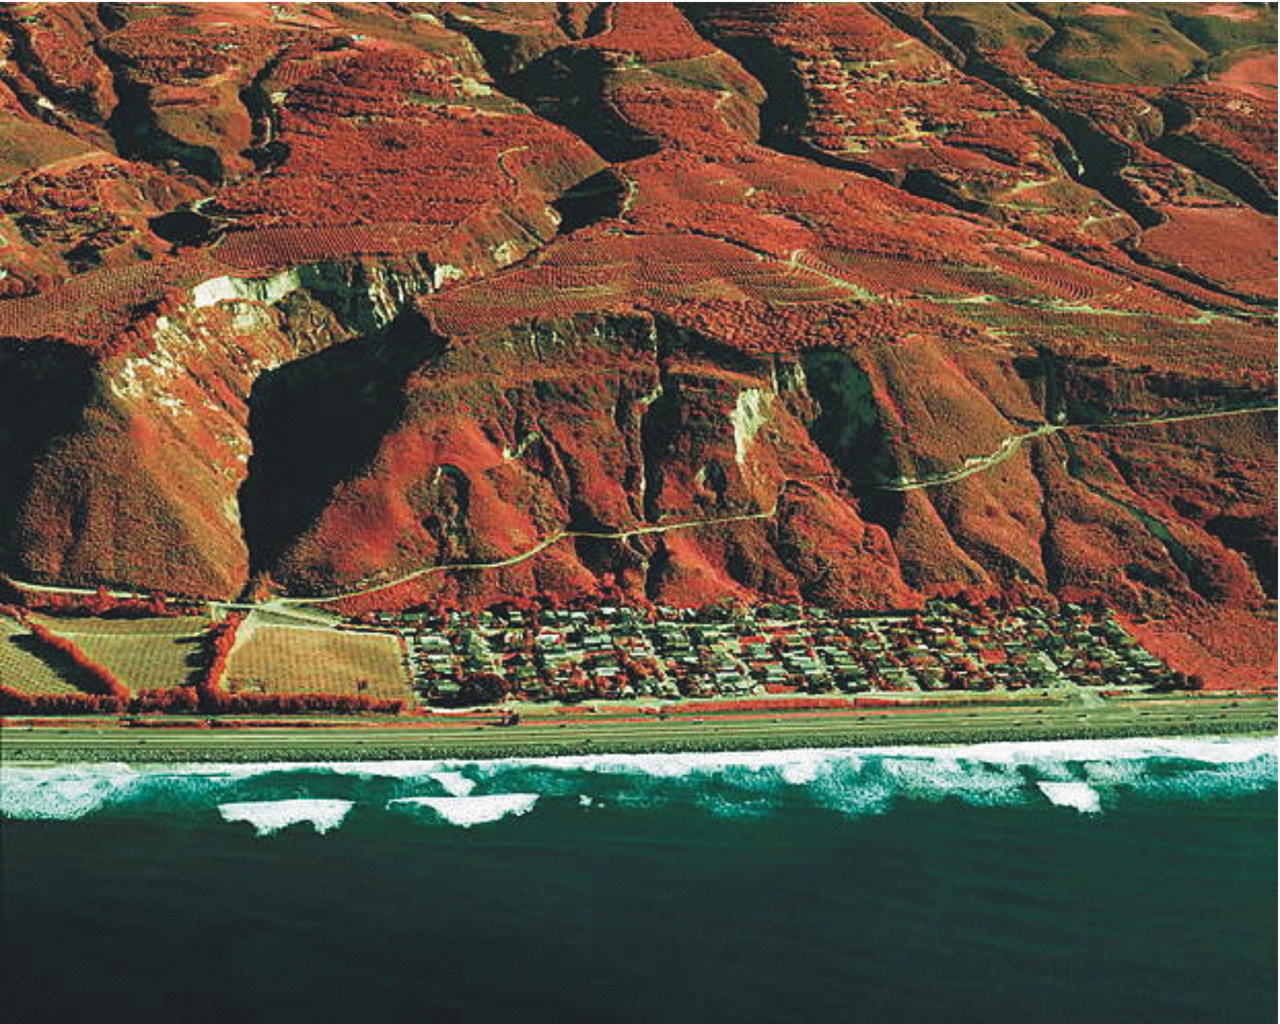
La Conchita is located on the southern California coastline midway between Ventura and Santa Barbara (fig. 1). The 11–ha (28–acre) community was first established in 1924 when subdivision created about 200 lots that mostly contain single–family residences. La Conchita lies on a narrow coastal strip about 250 m (800 ft) wide between the shoreline and a 180–m (600–ft) high bluff having a slope of about 35°; above the top of the bluff is a gently rising terrace surface covered by avocado and citrus orchards (fig. 2).
The bluff above La Conchita consists of poorly indurated marine sediment of the Monterey and Pico Formations. The upper part of the slope consists of interlayered siliceous shale, siltstone, and sandstone of the Middle to Upper Miocene Monterey Formation. The lower part of the slope is siltstone, sandstone, and mudstone of the Pliocene Pico Formation (O'Tousa, 1995). Rock of both formations is very weakly cemented and has been regionally associated with extensive landslide activity (Morton, 1971; Harp and Jibson, 1995, 1996; Parise and Jibson, 2000). The two formations are in fault contact along the active Red Mountain Fault, which extends across the slope face.
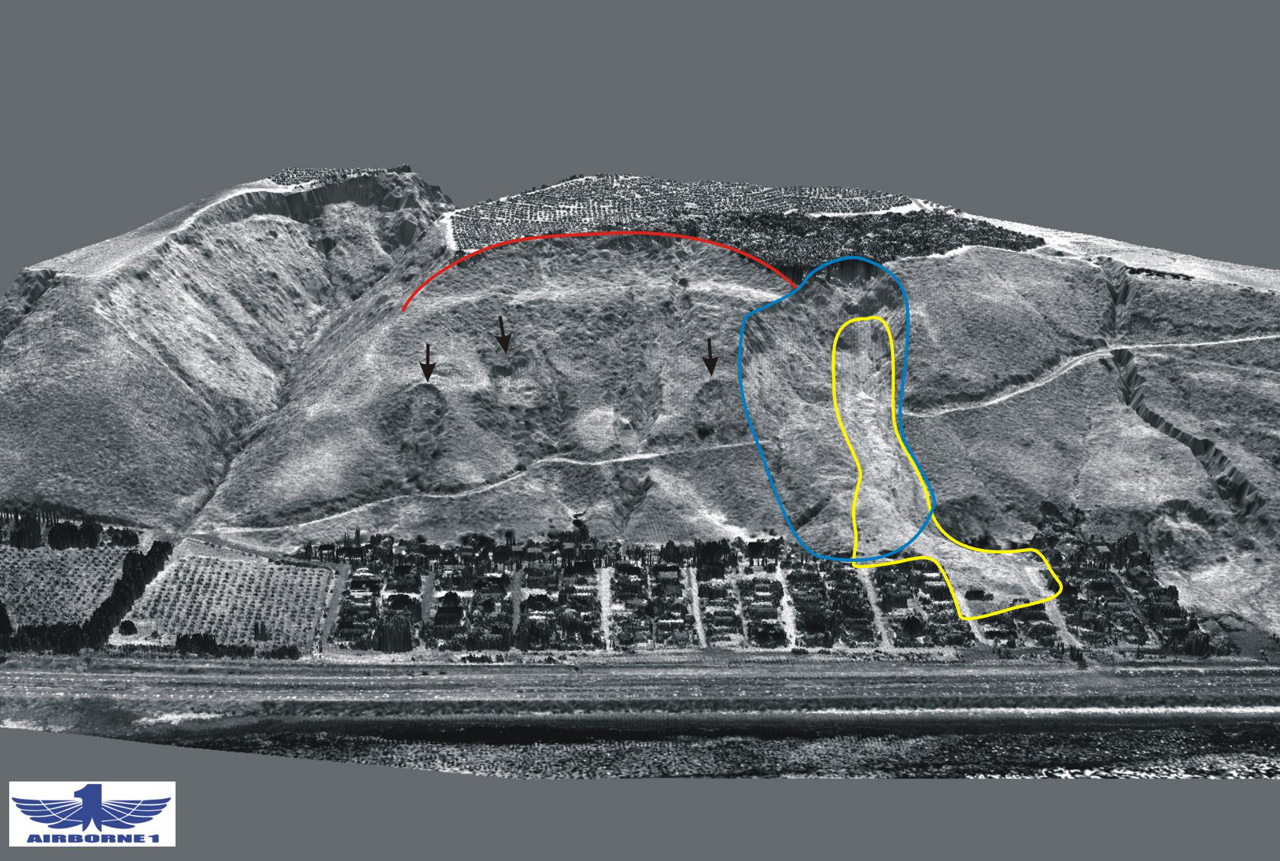
The bluff above La Conchita has produced a variety of landslides over an extended period of time. Figure 3 shows LIDAR and false–color infrared images of the bluff above La Conchita and the surrounding area, and several sizes, types, and ages of landslides are visible. The arcuate bench at the top of the bluff is the head of a very large prehistoric landslide that affected the entire bluff. Several smaller, more recent slumps and earth flows also are visible, as is the 1995 slump—earth flow (terminology after Varnes, 1978). Similar combinations of large ancient landslides and smaller, recently active landslides also are present in areas southwest of the 1995 and 2005 landslides. In addition, large and small ravines that incise the bluff have produced debris flows recently and in the past.
Historical accounts dating back to 1865 have reported landslides in the area around La Conchita as being a regular occurrence (Hemphill, 2001). The Southern Pacific rail line that extends along the coastal strip was inundated by landslide debris in 1889 and again in 1909, when a train also was buried (Hemphill, 2001). Since that time, landslides frequently have inundated roads, railroads, cultivated land, and more recently, the La Conchita community (O'Tousa, 1995).
The following summary of the 1995 La Conchita landslide is extracted from O'Tousa (1995) and Anderson (Robert Anderson, RJR Engineering, 2005, personal commun.). On March 4, 1995 at 2:03 p.m. PST, the La Conchita landslide failed and moved tens of meters in only a few minutes. The landslide, a complex slump—earth flow, destroyed or severely damaged nine houses. On March 10, a subsequent debris flow from a canyon to the northwest (see canyon on left part of figs. 2 and 3) damaged five additional houses in the northwestern part of La Conchita. The main mass that failed is on the southeastern margin of the larger ancient landslide that encompasses the entire front of the bluff (see fig. 3). The 1995 slide was 120 m (400 ft) wide, 330 m (1100 ft) long, and covered approximately 4 ha (10 acres). The depth was estimated at greater than 30 m (100 ft), and the volume was estimated at 1.3 million m3 (1.7 million yd3).
|
|
Incipient movement of the upper part of the slide was reported as early as the summer of 1994, when surface cracks were observed in the upper part of the slope (O'Tousa, 1995). Deformation continued as the rainy season began, and by December 1994, several open cracks on the hillside were channeling surface runoff into the subsurface. Several smaller landslides occurred between the summer of 1994 and March 1995, when the large slide occurred.
The 1995 landslide apparently occurred as a result of an extraordinarily wet year. Mean seasonal rainfall at Ojai (20 km [12 mi] northeast of La Conchita) from October 1 through March 3 (the day before the landslide occurred) is 390 mm (15.37 in) (National Oceanic and Atmospheric Administration, 1994a, 1995a). In 1994—95, about twice as much rain—761 mm (29.96 in)—fell during that period (National Oceanic and Atmospheric Administration, 1994b, 1995b). Figure 4 shows the rainfall distribution during the 1994—1995 rainy season. Most of the excess rain fell in January, which had 623 mm (24.53 in) as compared to a normal rainfall of 108 mm (4.26 in). February 1995 produced only about one–third of the normal rainfall, but a modest storm on March 2—3 produced 21 mm (0.81 in) of rain. The La Conchita landslide then occurred on March 4.
|
As discussed above, the 1995 landslide was relatively deep and primarily moved as a coherent slump—earth flow. This mode of movement suggests that the landslide formed as a result of rising ground–water levels in response to deep infiltration of antecedent seasonal rainfall. In particular, the extraordinary rainfall of January 1995 probably was the principal contributing factor to the elevated ground–water levels and, hence the landslide movement. The storm of March 2—3 also may have played a role in triggering initial movement of the hillside, which already was approaching instability due to longer–term seasonal rises in ground–water levels. Eyewitness accounts indicate, however, that similar to 2005, dust was in the air and much of the deposit included relatively dry material. Eyewitnesses also reported seeing material failing from the main scarp and lateral margins of the landslide as a result of removal of lateral support.
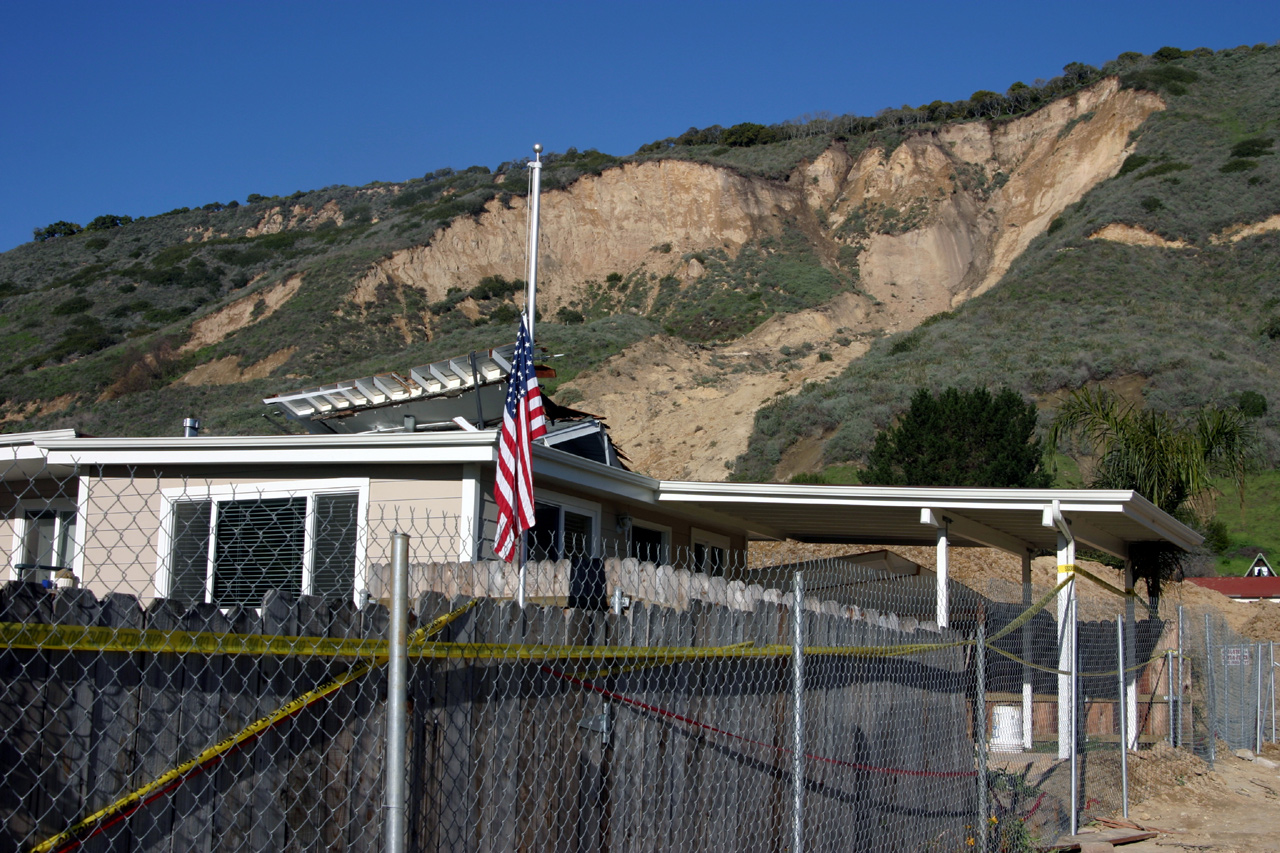
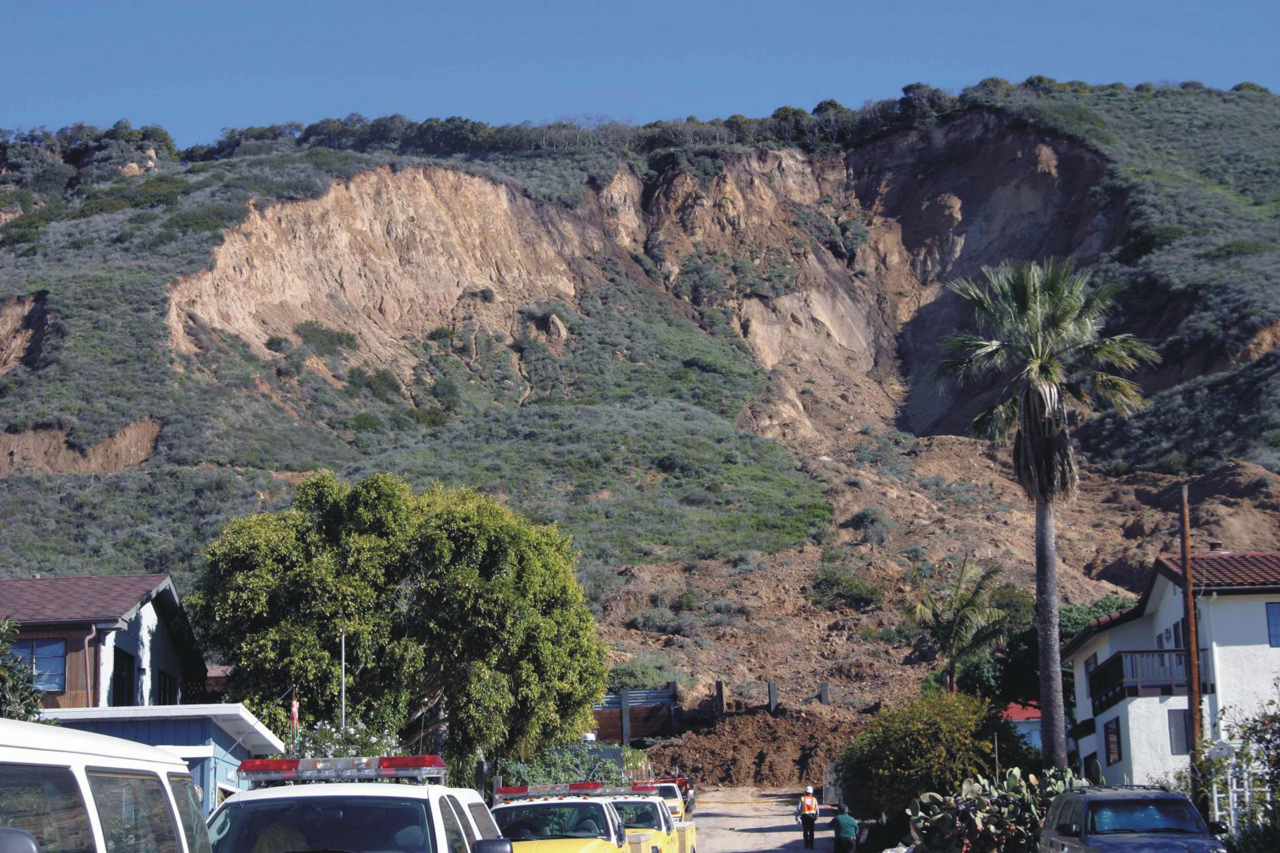
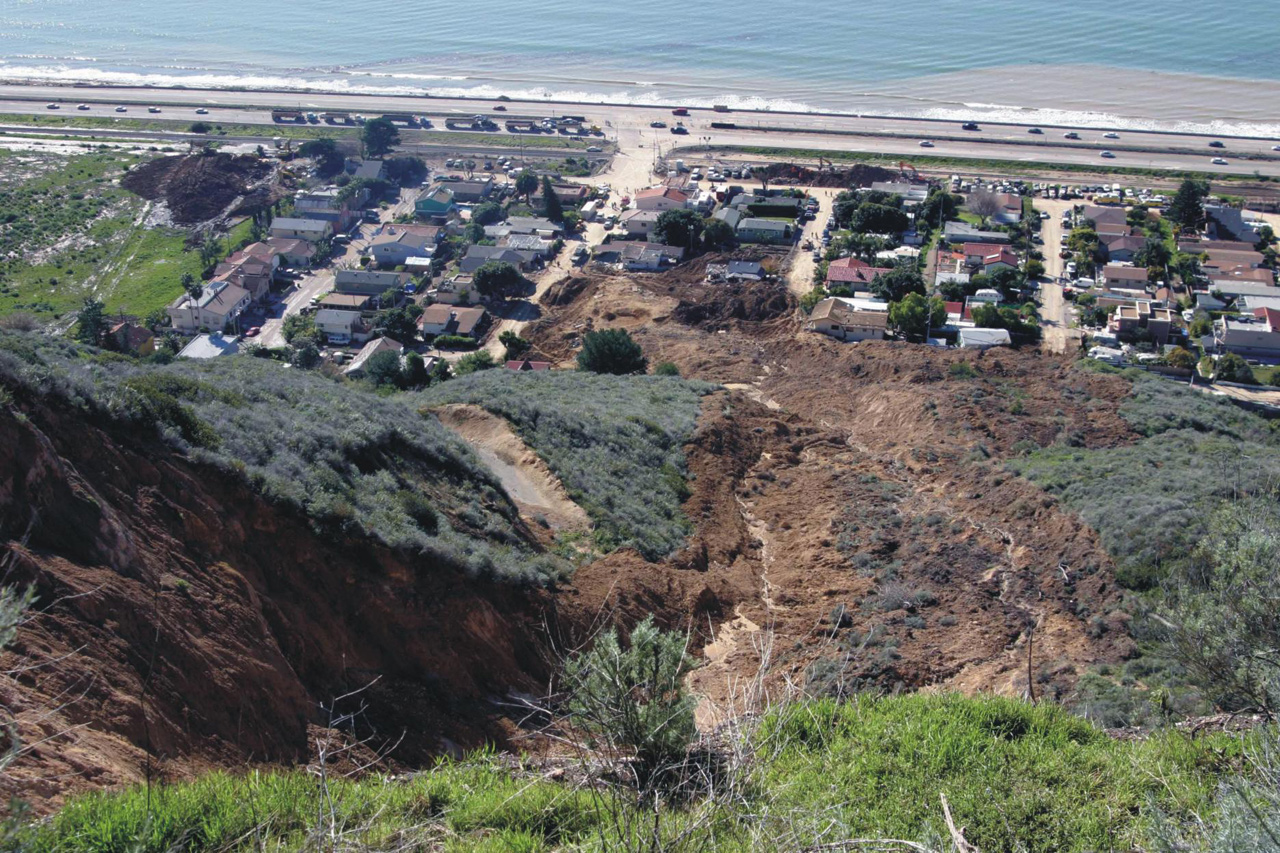
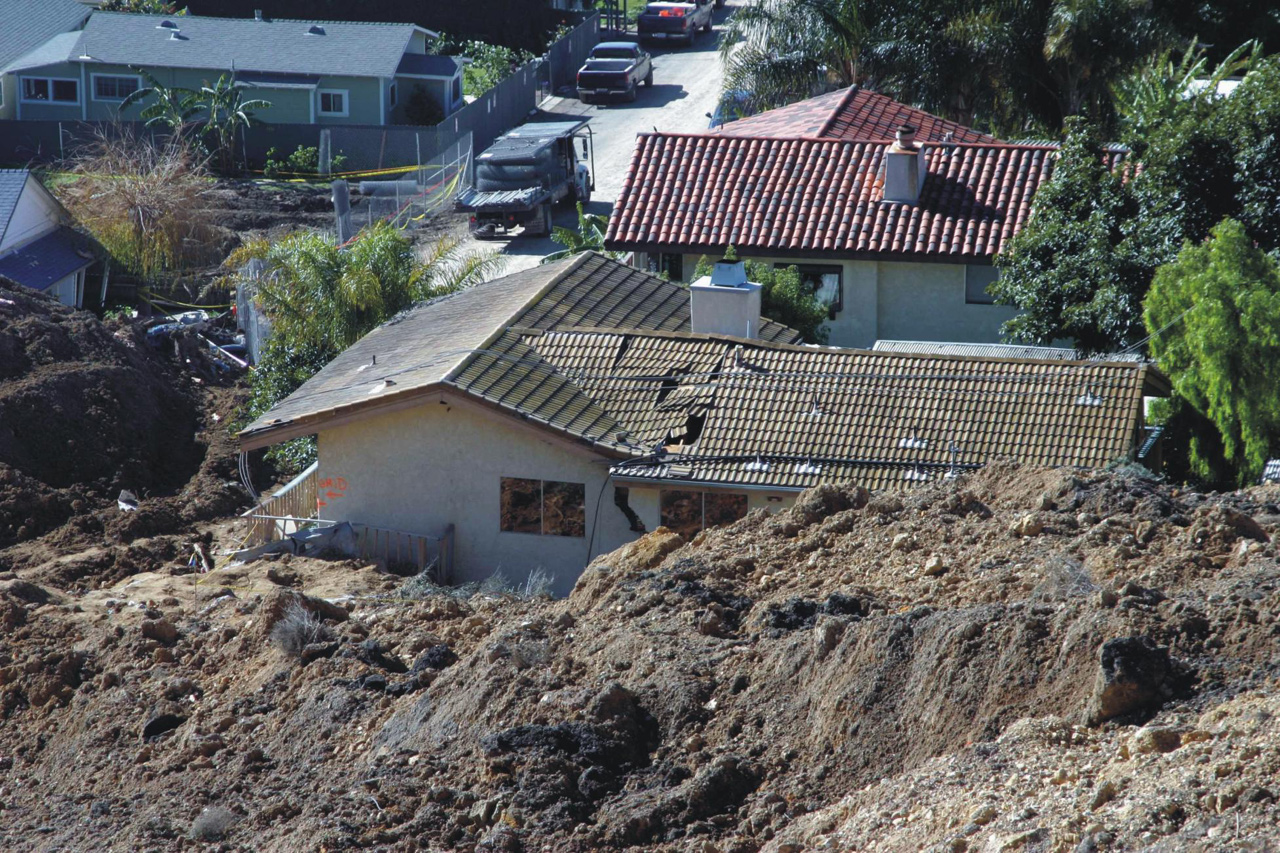
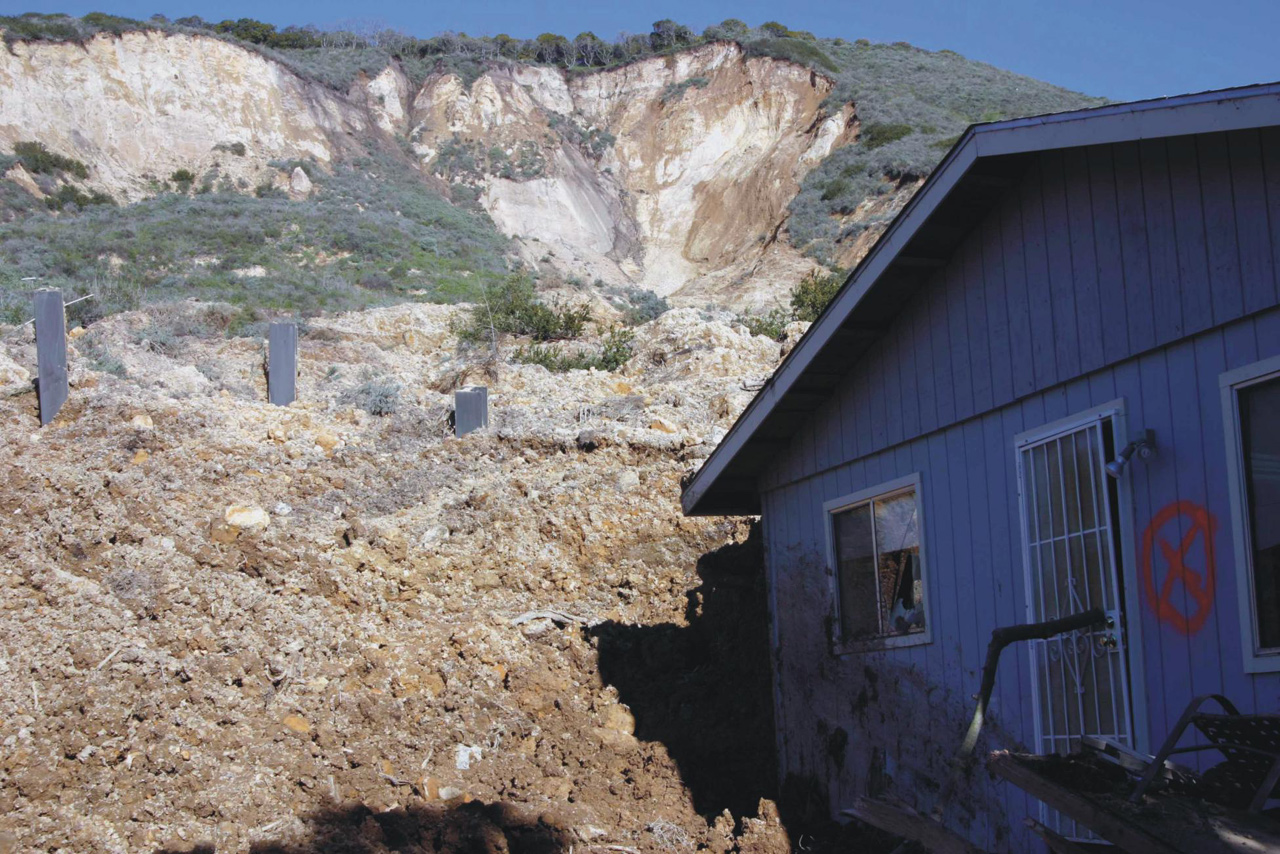
The 2005 La Conchita landslide occurred at about 12:30 p.m. on January 10. Little or no newly failed material was involved in the landslide; rather, it consisted of a remobilization of the southeastern portion of the 1995 landslide deposit, involving about 200,000 m3 (250,000 yd3) (James O'Tousa, RJR Engineering, personal commun., 2005). The landslide area was approximately 350 m (1,150 ft) long and 80—100 m (260—330 ft) wide. The landslide entered the La Conchita neighborhood destroying 13 houses and severely damaging 23 others (figs. 5 and 6). There were 10 confirmed fatalities.
|
|
|
Earlier that morning, debris flows from canyons northwest of La Conchita reached Highway 101. Law enforcement officers and media representatives were in the area, which facilitated capturing the moving landslide on video. The KCAL–TV video indicates that the landslide material mobilized simultaneously and nearly instantaneously into a highly fluid, rapidly moving debris flow. I estimate from viewing the video that high on the slope, the landslide was moving perhaps 10 m/s (30 ft/s). The developed part of the slope where the houses were impacted has a flatter slope, and so the flow probably slowed to no more than 5 m/s (15 ft/s) in the neighborhood. This slower rate also is suggested by eyewitnesses who stated that some residents were able to outrun the advancing flow, which would not have been possible at the higher upslope velocity.
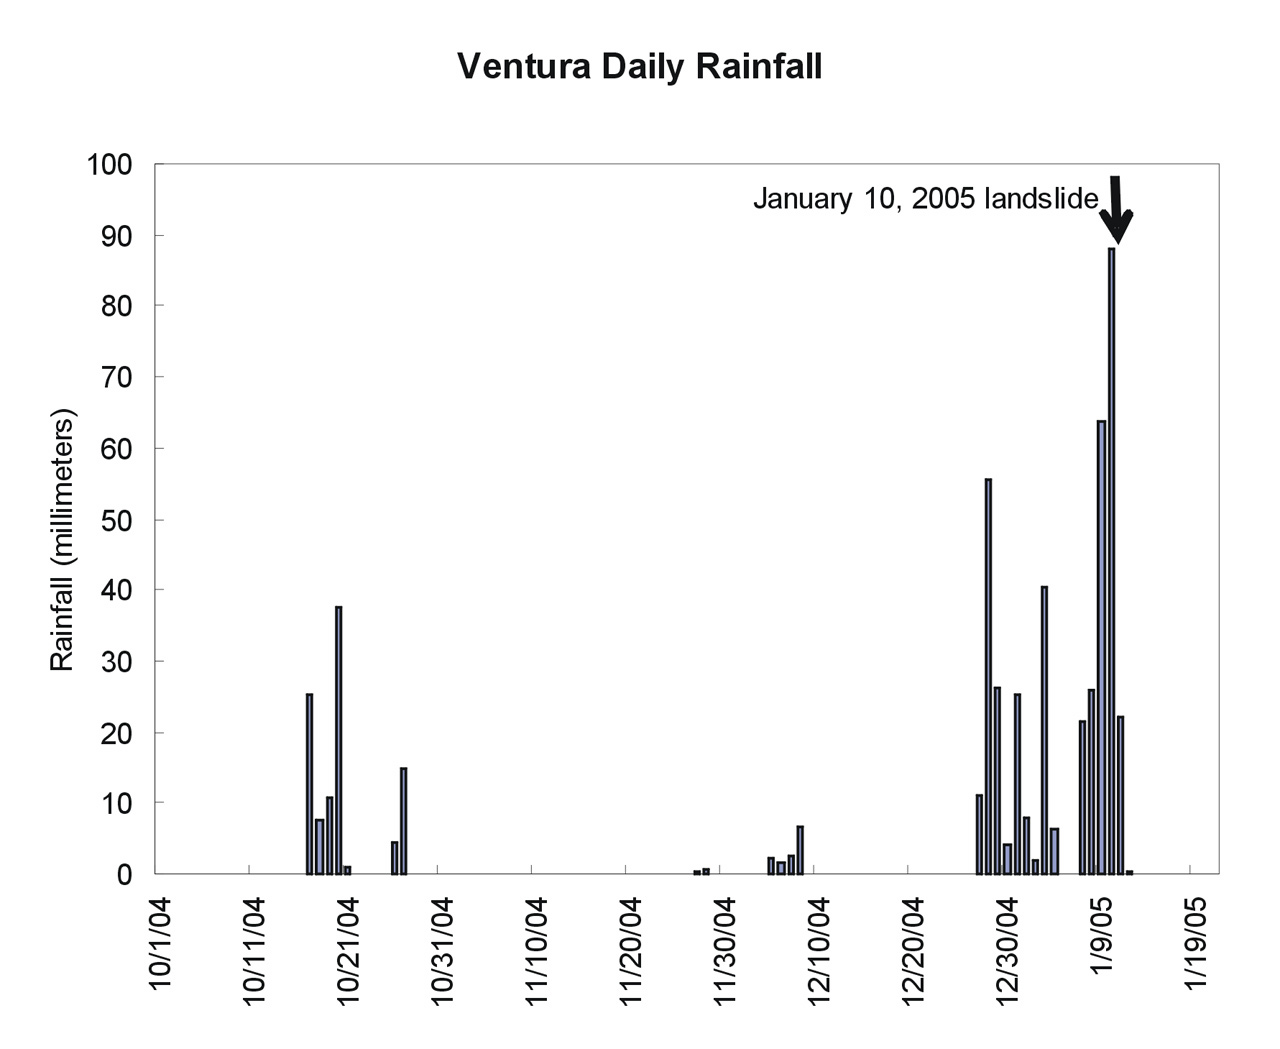
The 2005 landslide occurred at the end of a 15–day period that produced record and near–record amounts of rainfall in many areas of southern California. At Ventura (20 km [12 mi] southeast of La Conchita) seasonal antecedent rainfall from October 1, 2004 through January 10, 2005 totaled 493 mm (19.4 in) as compared to the mean value of 122 mm (4.8 in). From December 27, 2004 through January 10, 2005, Ventura received 378 mm (14.9 in) of rainfall, only slightly less than its mean annual total of 390 mm (15.4 in) (Wofford, 2005; National Oceanic and Atmospheric Administration, 1994a, 1995a). Although rainfall intensities were not extreme, moderate– to high–intensity rainfall persisted for more than 2 weeks, and the landslide occurred at the culmination of this 15–day high–rainfall period (fig. 7).
|
|
Inspection of the site within a few hours of the landslide indicated that much of the deposit consisted of fairly dry material (James O'Tousa, RJR Engineering, personal commun., 2005). Also, the video shows dust in the air as the landslide flowed downslope. Thus, it appears that the landslide mobilized on a saturated layer deep in the 1995 deposit but that much of the material above this saturated zone was dry or nearly so. The video shows relatively intact vegetation being rafted on the surface of the rapidly flowing mass, which indicates that much of the landslide mass simply was being carried on the fluidized layer at depth, which presumably was much more saturated.
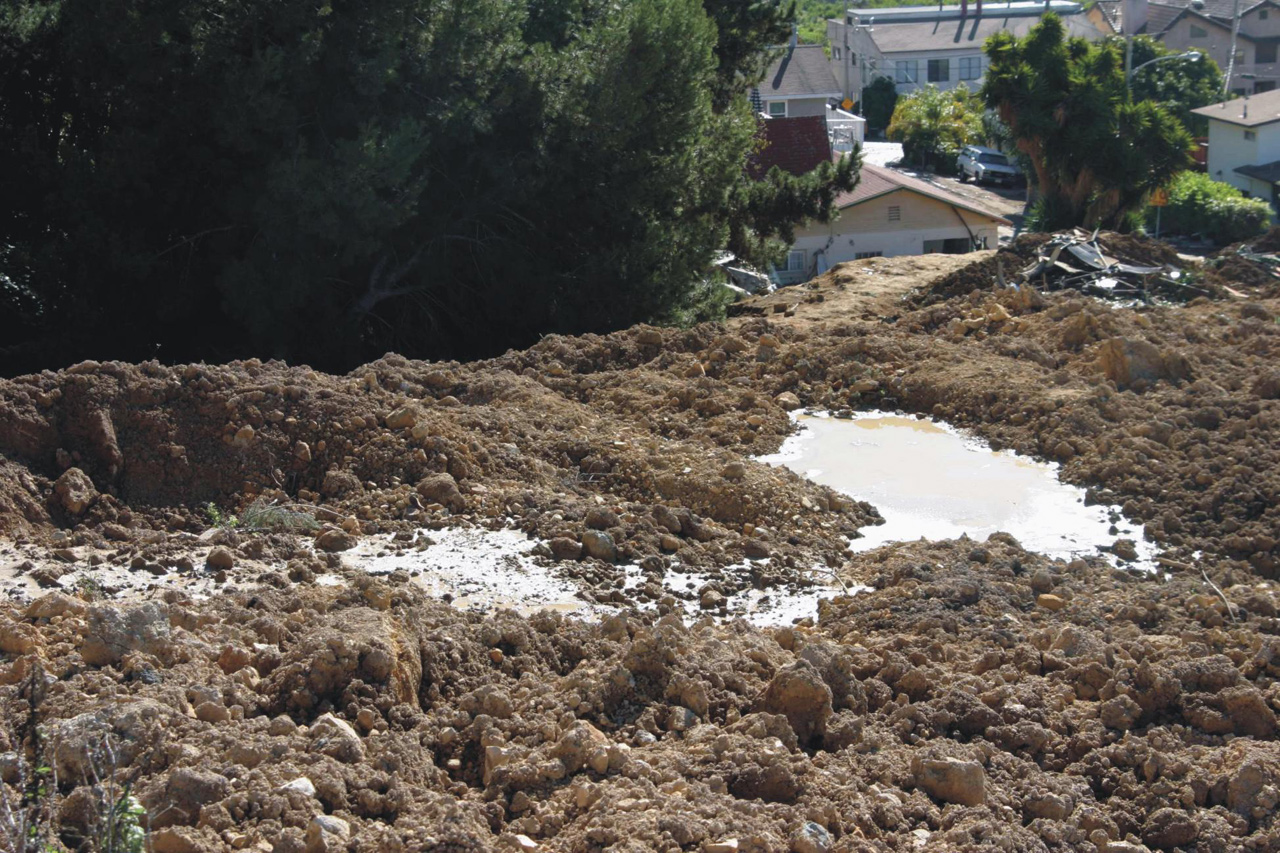
Such a failure scenario, involving a significant amount of dry material that fully mobilized on a saturated layer, indicates that most of the rain that fell on the surface of the 1995 deposit did not infiltrate but drained off the surface. The rising ground–water level within the 1995 deposit would thus have resulted from deeper recharge from rainfall infiltration upslope. Figure 8 shows an aerial photograph of La Conchita taken in September 2004. The lush, green vegetation visible in the southeastern (lower right in photograph) part of the 1995 deposit clearly indicates that drainage on and within the 1995 landslide deposit concentrated water in the part of the mass that failed in 2005. At the time of our visit (January 14, 2005) water was still issuing from the base of the main landslide scarp and was ponding at several locations on the 2005 deposit (fig. 9).
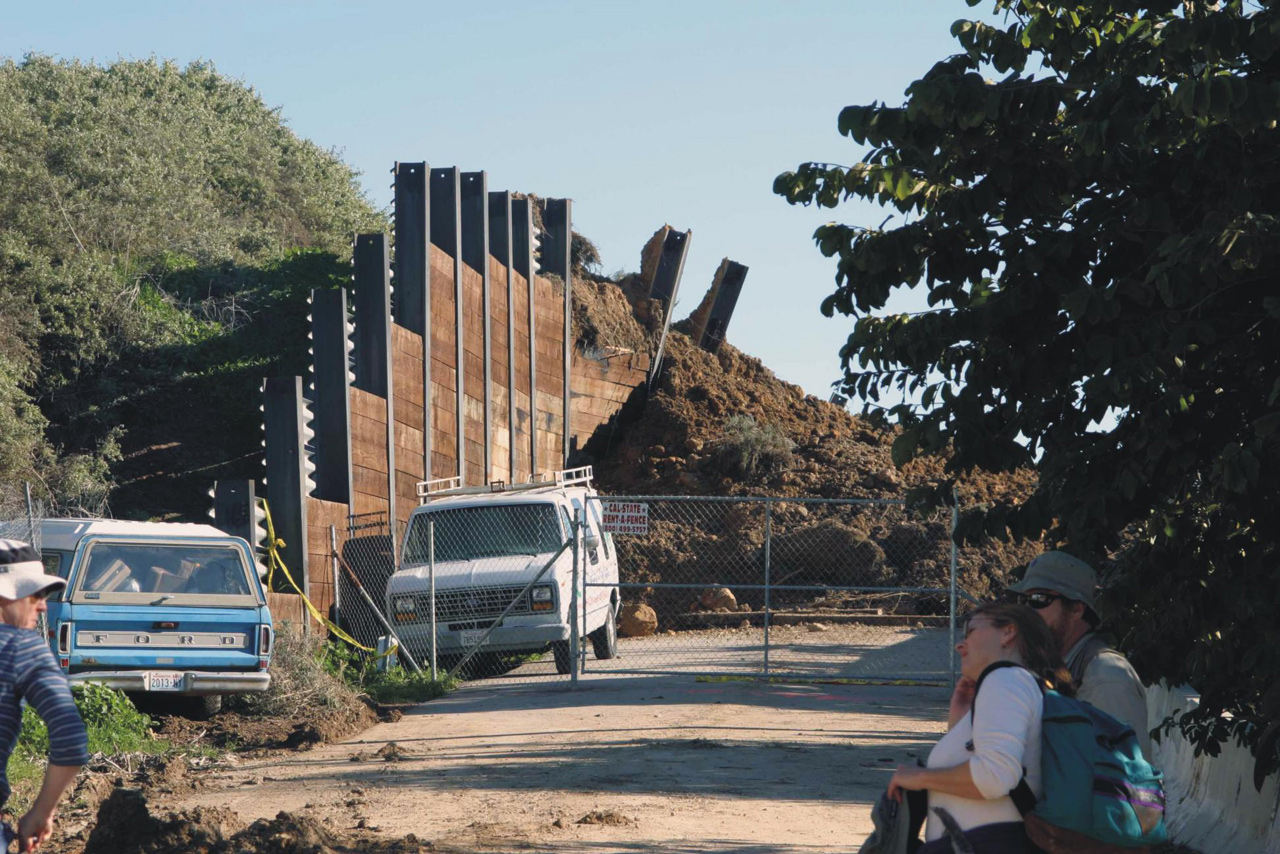
The 2005 landslide pushed many of the houses off their foundations and into each other at the toe of the landslide (figs. 10 and 11). A wall built after the 1995 landslide to keep minor landslide debris off the road was tilted forward and(or) overtopped in places by debris from the 2005 landslide (fig. 12). This indicates that the landslide material, although it flowed rapidly, was quite viscous and pushed structures in front of it rather than flowing around them or filling them with mud, as sometimes occurs with fully saturated debris and mud flows. This apparently resulted from a highly hazardous situation involving a two–phased landslide mechanism: (1) a saturated, highly fluid layer at depth on which the landslide mobilized that (2) carried a thick layer of drier, much more viscous material that effectively acted as a battering ram.
|
|
The movement of the same landslide mass in 1995 and 2005 by two very different mechanisms, and with markedly different results, is difficult to explain. The 1995 landslide was a deep, coherent slump—earth flow that deformed plastically and moved slowly enough that people could get out of its way. The 2005 landslide was a shallower remobilization of the very same material into a rapid, highly fluid debris flow that buried 10 people. Although it is not uncommon for subsidiary debris flows to occur from the toes or scarps of existing landslides (Morton and Campbell, 1989), that is not what happened in 2005. This was a wholesale remobilization of a significant portion of the 1995 deposit. How and why the same material failed twice in 10 years by fundamentally different mechanisms certainly will be the object of future research, and it is much too complex to analyze in detail at this time. A few things, however, can be said.
The timing of the two landslides with respect to the triggering storms is of primary interest. In 1995, after a very wet January, the landslide did not move until more than a month later, during which time very little rain fell (fig. 4). The deep mode of failure in 1995 is consistent with this delay: deeper landslides commonly are triggered by deep infiltration of rainfall, which can take weeks or months to occur (for example, Morton and Campbell, 1989). The 2005 landslide occurred at the culmination of an extremely wet 2–week period (fig. 7). This also is consistent with the shallower, fluid mode of failure: shallow, rapid debris flows most commonly occur during periods of prolonged, intense rainfall with little or no lag time (Campbell, 1975; Keefer and others, 1987; Jibson, 1989).
However, this still leaves some troubling questions unanswered. Why did the landslide material not mobilize into a rapid debris flow in 1995? What about the remaining 1995 deposit? Since only about 15 percent of the 1995 deposit remobilized in 2005, could the remainder also mobilize into a rapid debris flow, or is it more likely to remobilize as a deep slump? Or will it remain metastable? Currently, we have insufficient data and understanding of the failure mechanisms of this landslide to adequately answer these questions, but it is clear that the hazard from renewed landslide movement is considerable.
|
Of primary interest to the general public and various Governmental entities is the current state of hazard at La Conchita. While this preliminary report does not represent a detailed evaluation of those hazards, a few reasonable observations can be made.
|
|
The La Conchita area has experienced, and will likely continue to experience, a rather bewildering variety of landslide hazards. Different landslide scenarios are more or less likely to occur as a result of different specific rainfall conditions, and no part of the community can be considered safe from landslides. Unfortunately, we currently lack the understanding to accurately forecast what might happen in each possible rainfall scenario. Prudence would certainly dictate, however, that we anticipate renewed landslide activity during or after future periods of prolonged and(or) intense rainfall. Future earthquakes, of course, also could trigger landsliding in the area (Harp and Jibson, 1995, 1996).
Document Accessibility: Adobe Systems Incorporated has information about PDFs and the visually impaired. This information provides tools to help make PDF files accessible. These tools convert Adobe PDF documents into HTML or ASCII text, which then can be read by a number of common screen–reading programs that synthesize text as audible speech. In addition, an accessible version of Acrobat Reader 6.0, which contains support for screen readers, is available. These tools and the accessible reader may be obtained free from Adobe at Adobe Access.