|
|
|
|
|
| Report Home | Maps | Overview | Mapping Methods | Coastal Classifications | Geologic Setting | Coastal Processes | Coastal Vulnerability | Classification Summary | References | |||||||||||||||||||||||||||||||
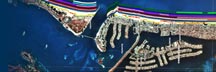
Mapping MethodsA coastal storm hazard assessment involves two different activities. The first is classification of ground conditions, and the second is translation of that information into a storm hazard vulnerability index. Present ground morphology and any man-made alterations of the land were first interpreted in the laboratory, using three independent visual sources:
The video tapes and slides are oblique low-altitude photographs of the beach obtained during helicopter surveys with horizontal positions determined by a Global Positioning System (GPS). Dates of the various surveys are presented in Table 1.
The video surveys, slides, and DOQQs were used to prepare the coastal classification units (Fig. 2) and to interpret the geomorphological and cultural attributes of each coastal segment. Elevations of the land surface adjacent to the barren backbeach were obtained by processing lidar data. The highest elevations of the foredunes or beach crest (where dunes are absent) are shown as a series of dots. Each dot is color coded to represent a narrow range of elevations. The units of elevation are decimeters, or tenths of meters. Maps of the Gulf shore of Alabama were field checked and corrected by Steve Jones of the Geological Survey of Alabama in July 2004. Observed changes in the Mississippi barrier island shores after Hurricane Ivan (Sept. 2004) were noted by Gary Hopkins of the National Parks Service in the fall of 2004. In some local areas, there are substantial differences between the backbeach position observed on the DOQQs and those observed on the lidar surveys. These differences are attributed generally to coastal dynamics and specifically to beach erosion, spit accretion, or inlet migration. Examples of discrepancies between the DOQQs and lidar surveys are shown on the Horn Island East NW and Ship Island NW maps. The dates of the surveys (Table 1) indicate which beach position is most recent. In all areas, the lidar survey is more recent than most of the DOQQ surveys. |
|||||||||||||