 |
|
|
||||
| Upper Midwest Environmental Sciences Center |
By Yao Yin, Jim Rogala, John Sullivan, and Jason Rohweder
U.S. Geological Survey Open File Report 2005-1233
This report is available as a pdf.
The ability to predict the distribution of submersed aquatic vegetation in the Upper Mississippi River on the basis of physical or chemical variables is useful to resource managers. Wildlife managers have a keen interest in advanced estimates of food quantity such as American wildcelery (Vallisneria americana) population status to give out more informed advisories to hunters before the fall hunting season. Predictions for distribution of submerged aquatic vegetation beds can potentially increase hunter observance of voluntary avoidance zones where foraging birds are left alone to feed undisturbed. In years when submersed aquatic vegetation is predicted to be scarce in important wildlife habitats, managers can get the message out to hunters well before the hunting season (Jim Nissen, Upper Mississippi River National Wildlife and Fish Refuge, La Crosse District Manager, La Crosse, Wisconsin, personal communication).
We developed a statistical model to predict the probability
of occurrence of submersed aquatic vegetation in Pool 8 of the Upper Mississippi River on the
basis of a few hydrological, physical, and geomorphic
variables http://www.umesc.usgs.gov/management/dss/sub_veg_model.html. Our model takes into
consideration flow velocity, wind fetch, bathymetry, growing-season
daily water level, and light extinction coefficient in the river (fig. 1)
 |
| Figure 1. A conceptual expression of the submersed aquatic vegetation model. |
and calculates the probability of submersed aquatic vegetation existence in Pool 8 in individual 5- x 5-m grid cells. The model was calibrated using the data collected in 1998 (516 sites), 1999 (595 sites), and 2000 (649 sites) using a stratified random sampling protocol (Yin and others, 2000b). To validate the model, we chose the data from the Long Term Resource Monitoring Program (LTRMP) transect sampling in backwater areas (Rogers and Owens 1995; Yin and others, 2000a) and ran the model for each 5- x 5-m grid cell in every growing season from 1991 to 2001. We tallied all the cells and came up with an annual average percent frequency of submersed aquatic vegetation occurrence and compared the results with actual LTRMP survey data (fig. 2).
 |
| Figure 2. Surveyed and predicted percent frequency of occurrence of submersed aquatic vegetation distribution in the transect sampling backwaters of Pool 8 of the Upper Mississippi River. Survey data were collected using a transect protocol (Yin et al. 2000b). Original data reported percent frequency on the basis of individual backwaters. The survey data used in the figure are the pooled means of all the backwaters on the basis of their respective acreages. LTRMP = Long Term Resource Monitoring Program. |
Both a paired Student’s test (P = 0.4620) and a Wilcoxon’s two-sample test (P = 0.4738) did not contradict our null hypothesis that the model prediction and the sampling data are statistically the same. We have not found an effective statistical test to compare model-predicted spatial pattern with aerial photography geographic information, but we are satisfied with the model’s outcome on the basis of visual inspection (fig. 3).
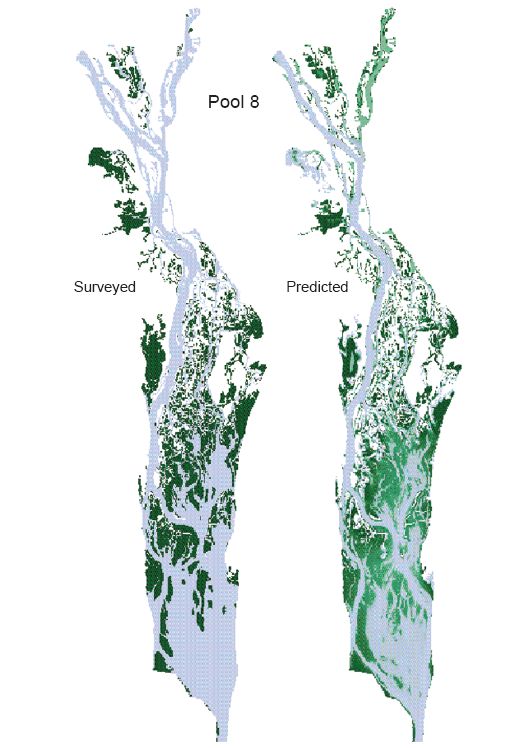 |
| Figure 3. Surveyed (left) and predicted (right) distributions of submersed aquatic vegetation distribution in Pool 8 of the Upper Mississippi River in 1989. The survey data were from the land cover/land use geographic information created by the U.S. Geological Survey Upper Midwest Environmental Sciences Center on the basis of interpretation of aerial photography of 1989. |
A unique feature about this model is that a prediction can be made by the end of June each year; therefore, providing wildlife managers an assessment of current year vegetation growth condition 3 to 4 months ahead of the arrival of migrating waterfowl that feed on submersed aquatic vegetation. We are working with the LTRMP partnership to create a mechanism so that model predictions (fig. 4) http://www.umesc.usgs.gov/management/dss/sub_veg_model.html can be updated annually and the results posted on the LTRMP Web site. Our model underestimated the prevalence of vegetation from 2001 to 2004. We speculate that the summer water level reduction conducted in 2001 and 2002 triggered vegetation responses that are outside the model’s domain. Future enhancement of the model will incorporate the summer water level drawdown effects as well as the effects of growth conditions in previous years.
 |
| Figure 4. Annual updates of predicted and surveyed status of submersed aquatic vegetation of percent frequency of submersed aquatic vegetation in Pool 8 of the Upper Mississippi River. LTRMP = Long Term Resource Monitoring Program. |
This report is available as a pdf. (2.2MB)
This report requires the Adobe Reader® to view (version 5 or higher preferred). If you do not have the Adobe Reader, it is available for free download from Adobe Systems, Inc.
Document Accessibility: Adobe Systems, Inc. has information about PDFs and the visually impaired. This information provides tools to help make PDF files accessible. These tools convert Adobe PDF documents into HTML or ASCII text, which then can be read by screen-reading programs that synthesize text as audible speech. In addition, a version of Adobe Reader that contains support for screen readers is available. The conversion tools and the accessible reader may be obtained free from Adobe through their conversion tools Web site.
For more information, please contact:
Yao Yin1, Jim Rogala2, and Jason Rohweder3
USGS Upper Midwest Environmental Science Center
2630 Fanta Reed Road
La Crosse, Wisconsin 54603
John Sullivan4
Wisconsin Department of Natural Resources
3550 Mormon Coulee Reed
La Crosse, WI 54601
Telephone: 1608-781-6350
E-Mail: yyin@usgs.gov
For information about water-resource studies in the State of Upper Midwest Environmental Sciences Center, please visit our Web site at http://www.umesc.usgs.gov.
| AccessibilityFOIAPrivacyPolicies and Notices | |
 |
|