
Coastal Vulnerability Assessment of Kaloko-Honokohau National Historical Park to Sea-Level Rise
USGS Open-File Report 2005-1248
|
Coastal Vulnerability Assessment of Kaloko-Honokohau National Historical Park to Sea-Level Rise USGS Open-File Report 2005-1248 |
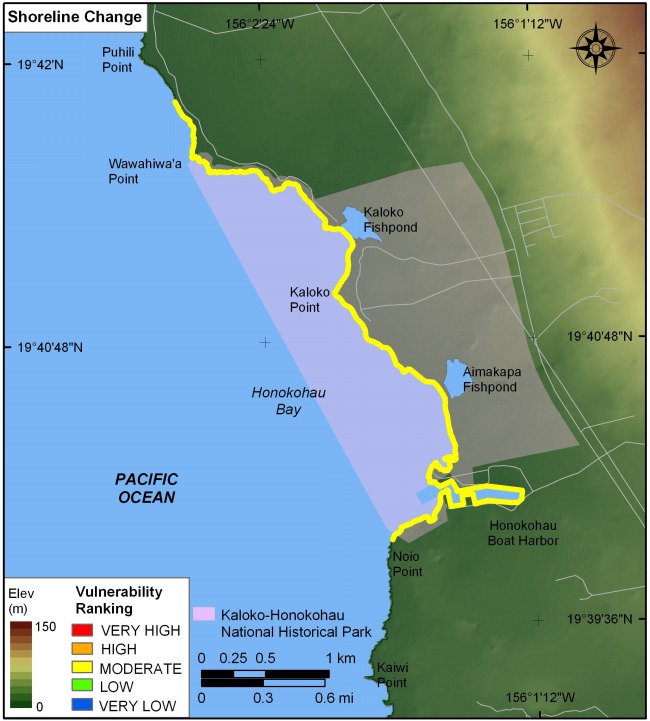
Figure 5. Shoreline change rates for Kaloko-Honokohau National Historical Park. The colored shoreline represents the rate of shoreline erosion or accretion. All of Kaloko-Honokohau National Historical Park is moderate vulnerability (-1m/yr - +1m/yr). | ||
 |
||


![]() U.S. Department of the Interior |
U.S. Geological Survey
U.S. Department of the Interior |
U.S. Geological Survey
URL: http://pubsdata.usgs.gov/pubs/of/2005/1248/html/fig5.html
Page Contact Information: Publication Services
Page Last Modified: 22:06:55 Sat 12 Jan 2013