Introduction
The National Park Service (NPS) is responsible for managing nearly 12,000 km (7,500 miles) of shoreline along oceans and lakes. In 2001, the U.S. Geological Survey (USGS), in partnership with the NPS Geologic Resources Division, began conducting hazard assessments of future sea-level and lake-level change by creating maps to assist NPS in managing its valuable coastal resources. This report presents the results of a potential for change assessment for three National Lakeshores on Lake Superior and Lake Michigan, highlighting areas that are likely to be most affected by climate change-induced lake-level changes.
Based on results of global climate models, the Great Lakes region is expected to experience warmer and drier climate conditions into the next century, which will likely result in a drop in lake levels (only one model, HadCM2, suggests that lake levels may rise) (U.S. Global Change Research Program, 2000). The magnitude and the timing of climate changes are uncertain, but recent studies show that the current drop in lake levels (since 1998) are the largest since the Dust Bowl of the 1930's, and are likely a result of higher than average air temperatures over the Great Lakes (Assel and others, 2004). Impacts associated with expected lake-level falls over the next century include decreases in winter ice volume on all the lakes and subsequent warmer water. Winter ice cover also helps to protect the shoreline from storm erosion; therefore, a decrease in annual ice cover could lead to greater shoreline erosion (Forbes and others, 2004). Reduced ice cover has already been linked to warmer than average air temperature associated with El Niño years in the Great Lakes (Nicholls, 1998). Warmer air temperatures could lead to increased evaporation that combined with warmer water would likely increase storminess. An increase in the frequency of storm conditions on the Great Lakes would produce more energy capable of eroding shorelines. Decreases in lake levels could reduce groundwater recharge, causing streams and wetlands to shrink or disappear and threatening groundwater resources in coastal zones. Shipping costs are likely to increase with lake-level decreases as harbor and channel dredging needs increase, and contaminated sediments could become exposed (U.S. Global Change Research Program, 2000).
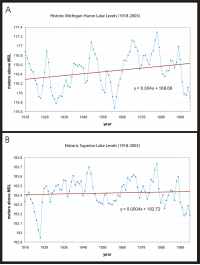 |
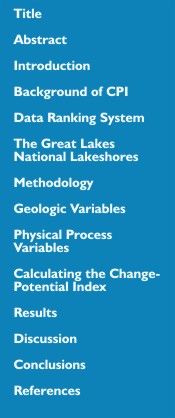
| Figure 1. Figure 1. Hydrographs of Lake Michigan-Huron (A) and Lake Superior (B) from 1918 - 2003, lake-level data provided by National Oceanic and Atmospheric Administration Great Lakes Environmental Research Laboratory (http://www.glerl.noaa.gov/) Click on figure for larger image. |
Throughout the 1900s, the Great Lakes showed a general trend of increasing lake levels with years in the 1970s and 1980s producing record lake-level highs (Figure 1). More recently, however, lake levels appear to be falling near to the long-term average. Because the exact response of lake levels to climate change is uncertain, there is a need in the geologic discipline to address the potential response of the lakeshore to water-level change. The Great Lakes have been proposed as a more manageable test environment than oceans for predicting shoreline response to water-level change (Hands, 1984). However, an accurate and quantitative approach to predicting shoreline change to water-level fluctuation in lakes or oceans is difficult to establish. Even the kinds of data necessary to predict response are the subject of scientific debate. A number of predictive approaches have been proposed (National Research Council, 1990 and 1995), including: 1) extrapolation of historical data (e.g., coastal erosion rates), 2) static inundation and withdrawal modeling, 3) application of a simple geometric model (e.g., the Bruun Rule), 4) application of a sediment dynamics/budget model, or 5) Monte Carlo (probabilistic) simulation based on parameterized physical forcing variables. However, each of these approaches has inadequacies or can be invalid for certain applications (National Research Council, 1990). Additionally, shoreline response to lake-level change is further complicated by human modification of the natural coast, such as beach nourishment projects, and engineered structures such as seawalls, revetments, groins, and jetties. Understanding how a natural or modified coast will respond to water-level change is essential for planning and protecting vulnerable coastal resources.
The primary challenge in predicting shoreline response to lake-level change is quantifying the important variables that contribute to coastal evolution in a given area. In order to address the multi-faceted task of predicting lake-level change impact, the USGS has developed and implemented a methodology to identify areas that may be most likely to experience coastal change (Thieler and Hammar-Klose, 1999). This technique, known as the Coastal Vulnerability Index (CVI), utilizes different ranges of vulnerability (low to very high) to describe a coast's susceptibility to physical change as sea level rises. The coastal vulnerability index was modified for coasts where water level is falling; a slightly different index was developed, the coastal change-potential index (CPI). The CPI used here is similar to the CVI and focuses on six variables that strongly influence coastal evolution on the Great Lakes:
- Geomorphology
- Historical shoreline change rate
- Regional coastal slope
- Relative sea-level change
- Mean significant wave height
- Mean annual ice cover
These variables can be divided into two groups: 1) geologic variables and 2) physical process variables. The geologic variables are geomorphology, historic shoreline change rate, and regional slope; they contribute to a shoreline's relative resistance to erosion, long-term erosion/accretion trend, and its relative potential for lateral change in the position of the lake-land boundary respectively. The physical process variables include significant wave height, annual ice cover, and lake-level change, which contribute to erosion hazards over time scales from hours to centuries. A relatively simple change potential ranking system (Table 1) allows the six variables to be incorporated into an equation that produces a change-potential index (CPI). The CPI can be used by scientists and park managers to evaluate the likelihood that physical change may occur along a shoreline as lake levels continue to change. Additionally, NPS staff may incorporate information provided by this change-potential assessment technique into general management plans.