Results
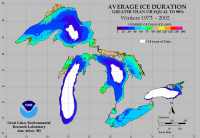 |
| Figure 11. Mean Annual Ice Duration for the Great Lakes for Winters 1973-2002 (Assel, 2003). Click on figures for larger image. |
Apostle Islands National Lakeshore
The CPI values calculated for Apostle Islands NL range from 1.00 to 7.30. The mean CPI value is 3.16; the mode is 1.73 and the median is 3.00. The standard deviation is 1.36. The 25th, 50th, and 75th percentiles are 2.00, 3.00 and 4.30, respectively. Figure 13A shows a map of the coastal change-potential index for Apostle Islands NL. The CPI scores are divided into low, moderate, high, and very high change potential categories based on the quartile ranges and analysis of the data. CPI values below 2.00 are assigned to the low change-potential category. Values from 2.00 to 2.90 are considered moderate change-potential. High change-potential values lie between 3.00 and 4.30. CPI values above 4.30 are classified as very high. Figure 14A shows the percentage of Apostle Islands NL shoreline in each change-potential category. Nearly 300 km (185 miles) of shoreline is evaluated along the Apostle Islands NL. Of this total, twenty-one percent of the mapped shoreline is classified as very high change potential due to future lake-level change. Thirty percent is classified as high, twenty-five percent as moderate, and twenty-four percent as low change potential.
Indiana Dunes National Lakeshore
The CPI values calculated for Indiana Dunes NL range from 6.32 to 12.91. The mean CPI value is 10.27; the mode is 10.00 and the median is 10.00. The standard deviation is 2.11. The 25th, 50th, and 75th percentiles are 9.0, 10.0 and 12.0, respectively. Figure 13B shows a map of the coastal change-potential index for Indiana Dunes NL. The CPI scores are divided into low, moderate, high, and very high change-potential categories based on the quartile ranges and analysis of the data. CPI values below 9.0 are assigned to the low change-potential category. Values from 9.0 to 10.0 are considered moderate change potential. High change-potential values lie between 10.10 and 12.00. CPI values above 12.00 are classified as very high change potential. Figure 14B shows the percentage of Indiana Dunes NL shoreline in each change-potential category. Nearly 24 km (15 miles) of shoreline is evaluated along the Indiana Dunes NL. Of this total, twenty-one percent of the mapped shoreline is classified as very high change potential due to future lake-level change. Twenty-three percent is classified as high, twenty-nine percent as moderate, and twenty-six percent as low change potential.

Figure 13A. Relative Coastal Change-potential for Apostle Islands National Lakeshore. em>Click on figure for larger image. |

Figure 13B. Relative Coastal Change-potential for Indiana Dunes National Lakeshore. |

Figure 13C. Relative Coastal Change-potential for Sleeping Bear Dunes National Lakeshore. Click on figure for larger image. |
Sleeping Bear Dunes National Lakeshore
The CPI values calculated for Sleeping Bear Dunes NL range from 3.87 to 8.94. The mean CPI value is 6.07; the mode is 7.07 and the median is 7.07. The standard deviation is 1.32. The 25th, 50th, and 75th percentiles are 4.50, 7.00 and 7.70, respectively. Figure 13C shows a map of the coastal change-potential index for Sleeping Bear Dunes NL. The CPI scores are divided into low, moderate, high, and very high change-potential categories based on the quartile ranges and analysis of the data. CPI values below 4.5 are assigned to the low change-potential category. Values from 4.50 to 7.0 are considered moderate change potential. High change-potential values lie between 7.00 and 7.70. CPI values above 7.73 are classified as very high change-potential. Figure 14C shows the percentage of Sleeping Bear Dunes NL shoreline in each change-potential category. Nearly 100 km (64 miles) of shoreline is evaluated along the Sleeping Bear Dunes NL. Of this total, thirty-seven percent of the mapped shoreline is classified as being at very high change-potential due to future lake-level change. Twenty-three percent is classified as high, eighteen percent as moderate, and nineteen percent as low.

Figure 14A. Percentage of Apostle Islands NL shoreline in each CPI category. Click on figure for larger image. |

Figure 14B. Percentage of Indiana Dunes NL shoreline in each CPI category. Click on figure for larger image. |

Figure 14C. Percentage of Sleeping Bear Dunes NL shoreline in each CPI category. Click on figure for larger image. |