Introduction
Most of the major urban centers of the United States, including Boston, New York, Washington, Chicago, New Orleans, Miami, Los Angeles, San Francisco, and Seattle - are located on a coast (Figure 1.1) and all of these discharge treated sewage effluent into adjacent waters. In 2000, 74% of the U.S. population lived within 200 km of the coast. Between 1980 and 2002, the population density in coastal communities increased approximately 4.5 times faster than in non-coastal areas of the U.S. (Perkins, 2004). More people generate larger volumes of wastes, increase the demands on wastewater treatment, expand the area of impervious land surfaces, and use more vehicles that contribute contaminants to street runoff. According to the National Coastal Condition Report II (EPA, 2005a), on the basis of coastal habitat, water and sediment quality, benthic index, and fish tissue, the overall national coastal condition is only poor to fair and the overall coastal condition in the highly populated Northeast is poor.
Scientific information is needed by managers to prioritize and regulate the uses of the coastal ocean that include recreation, commercial fishing, transportation, waste disposal, and critical habitat for marine organisms. These uses are often in conflict with each other and with environmental concerns. Developing a strategy for managing competing uses while maintaining sustainability of coastal resources requires scientific understanding of how the coastal oceanographic system behaves and how it responds to the many influences inflicted by man. This report provides a summary of a multi-disciplinary research program designed to improve our understanding of the transport and fate of contaminants in Massachusetts coastal waters.
Massachusetts Bay and Boston Harbor have been a focus of U.S. Geological Survey research because they provide a diverse geographic setting for developing a scientific understanding of the geology, geochemistry and oceanography of coastal systems in general. There is also a specific need for scientific data from this region to inform important economic, environmental and political issues. From the economic viewpoint, the annual value of tourism and shipping in Massachusetts and Cape Cod Bays is about $1.5 billion and $1.9 billion, respectively (EPA, 2005b). Commercial and recreational fishing generates about $240 million per year in the same region.
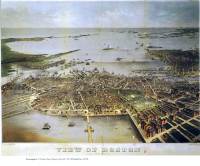
From an environmental viewpoint, there is a 300-year history of waste discharge from the Boston metropolitan area into the harbor. This history is punctuated by cycles of environmental degradation, public outcry, and improvements in the sewage treatment system. But with each improvement, the continuous growth of population in greater Boston (Figure 1.2) and the resulting increase in volumes of waste exceeded the treatment system, thereby setting the stage for a new pollution crisis. By the 1980's, the levels of contaminants in sediments of Boston Harbor were among the highest in the nation (NOAA, 1987). Fish were diseased, shellfish beds were closed, swimming beaches were unsafe after heavy rains, water quality and aesthetics were below acceptable standards.
Legal and political issues have always been part of Boston Harbor's history. The deplorable environmental conditions in the 1980s were highlighted in a 1983 legal suit brought by the city of Quincy against the Metropolitan District Commission (MDC, the state agency responsible for sewage treatment) and heads of three state agencies for discharging untreated or poorly treated sewage into the harbor (Dolin, 2004). The suit never went to trial, but through the actions of Massachusetts Superior Court Judge Paul Garrity, the issue of Boston Harbor pollution remained on the political and public agenda. Garrity called the harbor "unsafe, unsanitary, indecent, in violation of the law (Clean Water Act), and a danger to the health and welfare of the people" (Forman, 1984). To force the state legislature to implement a plan to improve harbor conditions, Garrity threatened to place the MDC in receivership and curtail new sewage hookups for industry. Under intense lobbying by business, the legislature created the Massachusetts Water Resources Authority (MWRA) in December 1984. The independent MWRA was established to manage Boston's waste treatment system and was given the authority to float bonds to pay for major improvements in the treatment system.
In mid 1985, Federal Court Judge David A. Mazzone began hearings on a suit brought by the Conservation Law Foundation, the Environmental Protection Agency, and towns of Quincy and Winthrop against the MDC and MWRA (as heir to responsibilities of the MDC) for years of violation of the Clean Water Act. Judge Mazzone ruled against the defendants and required all the parties to devise a construction plan and schedule for a new sewage treatment system. From these submissions, he developed a schedule for treatment system upgrades that would give the "citizens of this commonwealth a public assurance that Boston Harbor will be cleaned up within a defined period of time" (Dolin, 2004).
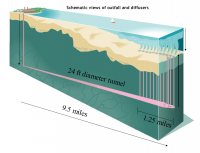
The MWRA's Boston Harbor cleanup program (Levy and Connor, 1992) was designed to transform the Boston sewage system. Key improvements were to include: 1. reduction in contaminants at the industrial source; 2. remediation of leaks in the sewage-collection system; 3. elimination of sewage sludge discharge to the harbor; 4. upgrading of sewage treatment from primary to secondary; 5. construction of a new ocean outfall for discharge of treated effluent located 9.5 miles offshore in Massachusetts Bay (Figure 1.3); and 6. implementation of scheduled improvements of combined sewer overflows. This harbor cleanup program was to cost approximately $4 billion.
As part of the harbor cleanup program, the MWRA developed a comprehensive monitoring program (recently summarized in MWRA, 2004) to assess changes in the harbor and bays that specifically related to the new sewage system. Additional information about conditions and processes in the coastal system on a regional scale and over a long time period was and continues to be needed in order to predict and interpret local change. These broader needs of the MWRA, and the mission of the USGS to understand the geology of the nation's offshore waters, provided an opportunity to conduct a cooperative multidisciplinary research program. This USGS program addresses basic scientific questions as well as concerns raised by management regarding the design, implementation, and assessment of the new sewage treatment system. Already active in Boston Harbor during the late 1970's, the USGS expanded research into Massachusetts Bay with a multidisciplinary program in 1989.
Regional Geologic Setting
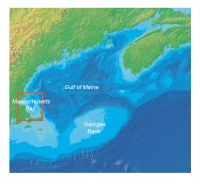
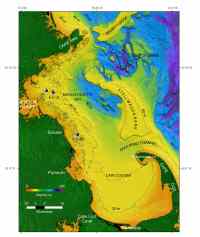
Massachusetts Bay and Cape Cod Bay form a semi-enclosed basin about 100 km long and 50 km wide located in the western Gulf of Maine, offshore of Boston, Massachusetts (Figures 1.4, 1.5). Massachusetts Bay is open to the Gulf of Maine along the eastern boundary between Cape Ann and Cape Cod. Stellwagen Bank, a shallow bank along the eastern side of Massachusetts Bay rises to within about 30 m of the sea surface, and partially separates the bay from the Gulf of Maine. Two channels, one to the south of Cape Ann and one to the north of Cape Cod provide connection to the Gulf of Maine at about 60 m water depth. Stellwagen Basin, a topographic low to the west of Stellwagen Bank, is the deepest part of Massachusetts Bay with maximum water depth of 95 m. Cape Cod Bay, located between Cape Cod and the Massachusetts coast, is open to Massachusetts Bay to the north; the deepest water depth is 40 m.
The major topographic features and the distribution of sediment types in this coastal region provide clear evidence of the past glacial history. Twenty-one thousand years ago, the continental ice sheet was 5000 feet thick in this region (Denton and Hughes, 1981). The glacier scoured what is now Stellwagen Basin, deposited boulders in elongated low hills (drumlins) in western Massachusetts Bay, and contributed coarse sand and gravel to what is now Stellwagen Bank. Extensive erosion of glacial sediments took place as the shoreline crossed the inner continental shelf three times following ice retreat (Oldale and others, 1993). Modern current patterns, particularly those during storms, continue to winnow deposits of glacially-derived sand and gravel from Stellwagen Bank and Jeffereys Ledge (20-40 m water depth). The inner shelf of western Massachusetts Bay to a depth of 40-50 m, covered by rock, gravel, and sand with almost no mud, is exposed frequently to wave-generated currents associated with storms from the northeast. Stellwagen Basin is floored with fine-grained mud. The basin is generally considered to be a tranquil long-term depositional site for sediments winnowed from the inshore areas and the shallow banks. Sediment accumulation rates here are less than 0.3 cm/yr [Crusius and others, 2004].
The complex topography, different sediment types and energetic oceanographic conditions off coastal Massachusetts provide a wide variety of habitats for marine organisms, which contributes to the importance of this region as the focus of multidisciplinary environmental studies.
The USGS Program
The USGS has led a multi-disciplinary research program designed to provide answers to both science and management questions associated with contaminant transport in coastal waters. The program is carried out in collaboration with colleagues from the Woods Hole Oceanographic Institution (WHOI) and in cooperation with the MWRA and the U.S. Coast Guard. The program's overarching objective is to develop and test the capability to predict the transport and long-term fate of wastes discharged to the coastal oceans.
Sediments are the focus of this study because they adsorb many contaminants dissolved in seawater and serve as a vehicle for contaminant transport. Fine-grained sediments (silt and clay-sized particles) are strong adsorbers because of their large surface area per unit mass. Understanding the mechanisms and rates by which sediments are resuspended, transported, and buried yields insight into the fate of particle-bound contaminants. Once introduced to the bottom sediments, some contaminants undergo redox-driven reactions and cycle between dissolved and particulate phases, migrate within the sediment column, and under some conditions, diffuse back into the overlying water. Repeating the cycle, the contaminants may be again adsorbed and transported by suspended sediment. The complexity of these processes adds to the challenge of understanding contaminant buildup and variability.
The USGS program has the following major components; and results are presented in subsequent sections of this report:
Sea-Floor Mapping
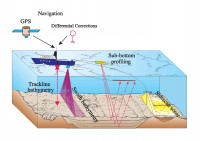
The USGS mapping approach combines sidescan sonar, high-resolution multibeam echosounding, seismic reflection profiling (Figure 1.6), sediment sampling, and bottom photographs and video observations to characterize the sea floor. In contrast to earlier maps that were based on widely spaced data, the new surveys provide maps of the seafloor with resolution of a few meters that are similar in detail to aerial photographs (Butman and others, 2004b; Butman and others, 2003a, b, c). The maps can be interpreted to show on a broad regional scale the locations of sediment types, areas of sediment deposition and erosion, and the effects of human activities, such as waste disposal and bottom trawling with fishing gear. The seafloor in Massachusetts Bay is extremely variable over small spatial scales and early versions of these new USGS maps (Bothner and others, 1992) were critical for determining appropriate sampling sites for the MWRA monitoring program and to select the location of the new offshore outfall.
Current and Sediment Transport Measurements
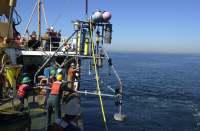
Since 1989, arrays of moored instruments (Figure 1.7) have been maintained at a site in Massachusetts Bay that have made almost continuous measurements of oceanographic parameters such as temperature, salinity, currents, pressure, light transmission, and bottom characteristics (Butman and others, 2004a). The instruments document oceanographic conditions during infrequent events, such as red tide outbreaks, and during more frequent events, such as storms, which are responsible for resuspending and transporting sediment and sediment-bound contaminants. The instruments also define seasonal and inter-annual variability of oceanographic conditions.
Geochemical Measurements and Data Base
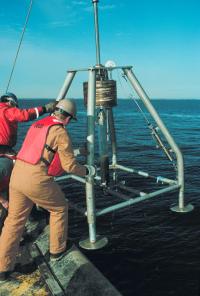
Since 1989, samples of the surficial and subsurface sediments have been collected three times per year in Massachusetts Bay near the new ocean outfall to establish temporal trends in metal concentrations and bacterial spores that are indicators of sewage (Figure 1.8). Samples have also been collected in the harbor and throughout Massachusetts Bay, although less frequently. Over the last few years, special studies have been conducted with colleagues at WHOI on geochemical processes within the surface sediments. These studies have examined the rates and depths of oxygen penetration into sediments, the cycling of metals between pore waters and the sediment particles, and the release of dissolved metals from contaminated sediments to overlying water by diffusion, advection, and resuspension (Kalnejais, 2005).
An early phase of the geochemical work on this project included the compilation and synthesis of existing data from published and unpublished sources. The resulting Contaminated Sediments Database for the Gulf of Maine (Buchholtz ten Brink and others, 2003) has been instrumental in assessing temporal trends in coastal sediments and in identifying gaps in information that can be considered in the design of future studies.
Modeling Circulation and Sediment Transport
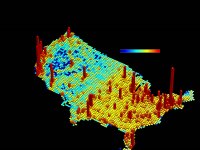
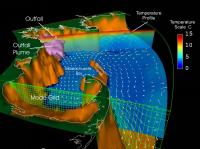
The USGS has used the Estuarine and Coastal Ocean Model (ECOM), originally developed by Blumberg and Mellor, (1987), to study the flushing characteristics of Boston Harbor, to provide input for a baywide water-quality model, and to predict the dilution of effluent entering the bay at the outfall. Over the past 15 years, the oceanographic community has further refined the model. The model (Signell and others, 2000) simulates currents and water properties in three dimensions over time, driven by wind, river runoff, offshore discharges from the outfall, surface heating and cooling, tides, and sea-level fluctuations in the open ocean (Figure 1.9). Modeling of sediment transport recently has been carried out using the Regional Ocean Modeling System (ROMS), an evolution of the ECOM system.
The following sections of this report describe examples of progress made in understanding marine processes that influence the behavior, transport, and fate of contaminants in coastal waters of Massachusetts. See Appendix 1 for a list of publications resulting from this USGS research program.
|
Click on figures below for larger images (PDF format).
 | Figure 1.1.
|
 | Figure 1.2.
|
 | Figure 1.3.
|
 | Figure 1.4.
|
 | Figure 1.5.
|
 | Figure 1.6.
|
 | Figure 1.7.
|
 | Figure 1.8.
|
 | Figure 1.9.
|
|