| The ocean currents in Massachusetts Bay mix and transport water and material in the Bay, and exchange water with the adjacent Gulf of Maine. The currents can conceptually be separated into tidal currents (which fluctuate 1-2 times each day), low frequency currents caused by winds and river runoff (which typically fluctuate with a period of a few days), and a residual current (typically steady over a few weeks). Understanding of the flow pattern, strength, and variability of the currents comes from field observations (Butman, 1976; Geyer and others, 1992; Butman and others, 2004a) and from simulations of the currents using numerical hydrodynamic models (for example Signell and others, 1996; Signell and others, 2000). Field observations provide measurements of the currents at selected locations over specific periods of time, while model simulations provide a view of the often complex spatial pattern of the flow. Direct observations and numerical simulations provide complementary descriptions of coastal currents that vary in space and time because of the complex bathymetry and coastal geometry of Massachusetts Bay, and because of the multiple processes (e.g. wind, river runoff, and currents in the Gulf of Maine) which drive the flow and change seasonally.
The oceanography of Massachusetts Bay may be conceptually separated into 4 seasonal intervals (following Geyer and others, 1992), based on winds and surface waves (Figure 4.1), the temperature and thermal stratification of the water column (Figure 4.2), the salinity, salinity stratification, and horizontal salinity gradients caused by river discharge (Figure 4.3), and the density stratification which results from the temperature and salinity (Figure 4.4). From November through March (winter), the water column is vertically well-mixed and the wind and surface waves are the largest of the year. In April and May (spring), the fresh water runoff is largest from the spring snow melt, the surface layer freshens, and the water column is vertically salt-stratified. In spring, there are also typically strong horizontal salinity gradients in the surface layers caused by the rivers which discharge fresh water along the coast. From June through August (summer), the seasonal thermocline develops, the vertical density stratification reaches a maximum, and the winds and surface waves are the weakest of the year. From September through October (fall), the water is cooling and the vertical stratification of the water column is decreasing from the strong summer stratification to well-mixed winter conditions.
The tides in Massachusetts Bay are dominated by the semi-diurnal tides. The tidal range is about 2.6 m, and varies from about 2.1 m to 3.1 m over a spring-neap cycle. At LT-A (Figure 3.1) the amplitude of the semi-diurnal tides M2 (period 12.42 hours), N2 (period 12.66 hours) and S2 (period 12.00 hours) is 1.29 m, 0.29 m, and 0.20 m, respectively, and the amplitude of the diurnal tides K1 (period 23.92 hours) and O1 (period 25.84 hours) is 0.11 m and 0.14 m, respectively. The amplitude and phase of the tidal elevation is nearly uniform throughout the bay. Tidal currents are largely bi-directional and flow into and out of the bay (Figure 4.5). The strength of M2 tidal currents are typically less than 0.20 m/s, except in the Race Point Channel, across the southern portion of Stellwagen Bank, and in the entrance to Boston Harbor where they exceed 0.5 m/s (Figure 4.5).
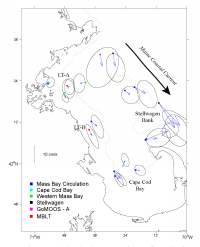
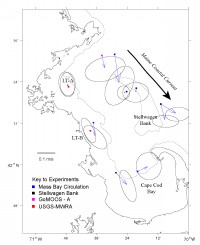
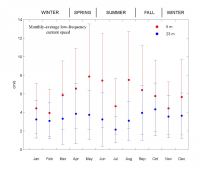
The low-frequency fluctuations in current, defined as currents that vary over a period of a few days, are driven primarily by the wind and by horizontal density gradients. In Massachusetts Bay, these fluctuations are typically 0.1 m/s (Figures 4.6a, 4.6b), generally larger than the 0.01-.05 m/s residual flow. Although the winds are strongest in winter, the low-frequency current fluctuations are largest in spring and summer (Figure 4.7). The strong currents in spring are driven by density gradients associated with lenses of fresh water caused by river runoff through Boston Harbor and from rivers that discharge into the Gulf of Maine to the north of Massachusetts Bay (Butman, 1976; Geyer and others, 1992). Along the western shore of Massachusetts Bay and in the Gulf of Maine Coastal Current, the low-frequency currents are strongest in the along-coast direction, but in the northwestern corner of Massachusetts Bay, over Stellwagen Bank, and in the center of Cape Cod Bay, the low-frequency currents do not have a strong preferred orientation (the low-frequency ellipses in Figures 4.6a, 4.6b are more circular).
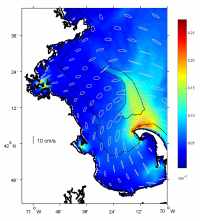
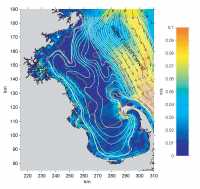
Information on the residual flow pattern in Massachusetts Bay comes from field observations (Figures 4.6a, 4.6b) and from model simulations. Simulations of the currents in Massachusetts Bay using a three-dimensional hydrodynamic model (Signell and others, 1996) for winter (defined as November through February) (Figure 4.8) and summer (defined as June through August) (Figures 4.9a, 4.9b), averaged for the years 1990-1992, provide a picture of the flow pattern in Massachusetts Bay that is quite consistent with the limited field observations (Figures 4.6a, 4.6b ). In both seasons, the Gulf of Maine Coastal current flows to the southeast at .05 -.1 m/s to the east of Stellwagen Bank. In winter (Figure 4.8) some of the Maine Coastal Current enters Massachusetts Bay south of Cape Ann, initially flowing to the south at a few cm/s. Some of the inflow turns eastward and exits Massachusetts Bay across Stellwagen Bank, some continues southward across Massachusetts Bay into Cape Cod Bay, and some flows southwestward toward Boston, then turns southeastward toward Cape Cod Bay. The residual flow is strongest, about 0.05 m/s, in the current along the western shore of Massachusetts Bay; a water particle takes about 15 days to reach the southern part of Cape Cod Bay from the area of the Massachusetts Bay outfall offshore of Boston. The flow in central Massachusetts Bay is very weak; a particle takes greater than 100 days to travel from Cape Ann to Cape Cod Bay.
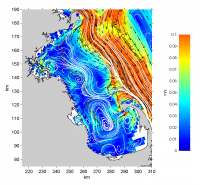
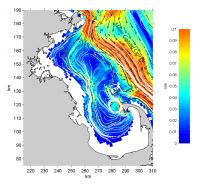
In summer at a depth of 5 m (Figure 4.9a), when the water column is stratified, there is a southerly flow into Massachusetts Bay south of Cape Ann. In contrast to winter however, all this flow occurs in the center of Massachusetts Bay, is joined by upwelled water from the northwest corner of Massachusetts Bay, and exits to the east across Stellwagen Bank; no surface flow enters Cape Cod Bay. Along the western shore, there is a weak flow to the northwest. In Cape Cod Bay, there is a clockwise circulation centered southeast of Plymouth Harbor, and a smaller counterclockwise circulation south of Provicetown. At 25 m depth (Figure 4.9b), below the seasonal thermocline, the principal features of the residual flow are the southeastward Maine Coastal current, and a southerly flow along the western side of Massachusetts Bay at about the 40 m isobath. In contrast to the near-surface flow, this southerly flow feeds a counterclockwise flow in Cape Cod Bay that exits north of Race Point. In winter and summer, with the exception of the Gulf of Maine Coastal current, the residual flows are less than 0.05 m/s and particle trajectories are most influenced by the tidal and low-frequency flow patterns.
|
Click on figures below for larger images (PDF format).
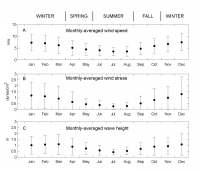 | Figure 4.1.
|
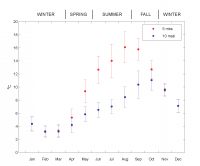 | Figure 4.2.
|
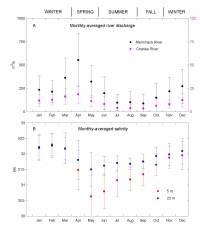 | Figure 4.3.
|
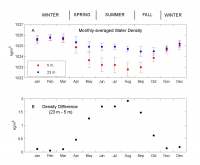 | Figure 4.4.
|
 | Figure 4.5.
|
 | Figure 4.6a.
|
 | Figure 4.6b.
|
 | Figure 4.7.
|
 | Figure 4.8.
|
 | Figure 4.9a.
|
 | Figure 4.9b.
|
|