|
An overall goal of the U.S. Geological Survey Massachusetts Bay research is to develop a regional understanding of the transport and long-term fate of sediment particles, and to use this understanding to help assess issues where these particles play a key role, such as the fate of contaminants and the characteristics of biological habitats. The sediment-transport research program carried out in Massachusetts Bay (Figure 1.5) has three components: (1) mapping of the sea floor to determine the distribution of sediments and contaminants (see Section 2), (2) long-term oceanographic observations of currents and sediment movement to identify key processes causing sediment transport and to provide data for testing numerical models (see Sections 3 and 4), and (3) development and application of a coupled hydrodynamic-sediment transport model to explore the transport and fate of particles on a regional basis caused by key processes. The complex geometry and varied sedimentary environments in Massachusetts Bay provide a natural laboratory for the development and testing of predictive capabilities for the transport and long-term fate of sediments.
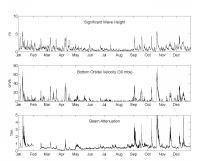
Over the last 25 years, observational and modeling studies have identified sediment transport by combined waves and currents as one of the most important processes causing sediment transport on continental shelves. The stress caused by the near-bottom oscillatory currents associated with surface waves (Grant and Madsen, 1979) cause sediment resuspension, while advection by wind-driven, density driven, and/or tidal currents cause net transport. The long-term observations at LT-A (see Figure 1.5 for location) show that storms, with large surface waves, are a key process that causes sediment resuspension in Massachusetts Bay (Figure 6.1); tidal currents, wind-driven currents, or currents associated with the spring runoff are typically not strong enough alone to resuspend sediments.
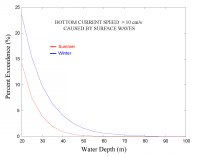
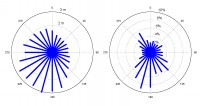
In Massachusetts Bay, a bottom oscillatory wave-driven current of about 0.1 m/s is sufficient to resuspend fine-grained bottom sediments (silt and clay). The percentage of time this threshold is exceeded decreases exponentially with water depth and is less than a few percent of the time in water deeper than 50 m (Figure 6.2); at any given depth, resuspension is more frequent in winter than in summer. The largest waves in Massachusetts Bay are associated with winds from the northeast (Figure 6.3) because of the unobstructed fetch from the Gulf of Maine. The resuspension, transport, and long-term fate of particles in Massachusetts Bay is the cumulative result of the transport by numerous storms with winds and waves from various directions, but dominated by the transport during storms with winds from the northeast (Northeast storms) and the large associated waves.
Model simulations using a coupled surface wave, hydrodynamic, and sediment transport model have been carried out to explore the effects of northeast storms on the transport and fate of sediments in Massachusetts Bay. Winds from the northeast storms that occurred in March 1997 and December 1992, two of the largest northeast storms observed between 1990-2002 (Table 6.1), were used in these simulations to drive the surface wave and circulation models. Winds used in the simulations for the March storm were held constant from 12° and winds during the December 1992 storm were constant from 50°. The semi-enclosed geometry of Massachusetts Bay produces a wind-driven surface flow in the direction of the wind in the shallow water along the coast in Massachusetts Bay and along the outer Cape, and flow opposite to the direction of the wind in deeper parts of Massachusetts or Cape Cod Bay (Figure 6.4).
Evolution of the surficial sediment distribution
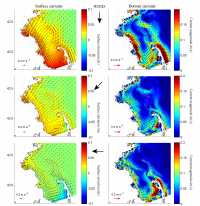
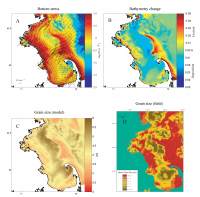
A simulation using the coupled hydrodynamic-sediment transport model was carried out to explore how a mixture of sediments (medium sand (2-3 phi) through medium silt (6 phi)) placed on the sea floor throughout Massachusetts Bay would be redistributed and winnowed under a series of ten northeast storms, similar to the December 1992 storm. The simulations show the location of increased bottom stress, sediment resuspension, and bathymetric change (Figure 6.5). The maximum combined wave and current stress at the peak of the storm is greatest in the shallow water along the coastline and on the crest of Stellwagen Bank and Jeffreys Ledge (see Figure 1.5 for locations), corresponding to locations of increased bottom wave orbital velocities. The bottom stress is lower in Stellwagen Basin, where the near-bottom wave currents are attenuated in the deep water, and in Cape Cod Bay because the Cape shelters the Bay from waves from the northeast. Along the western shore of Massachusetts Bay, combined wave and current stress is high between Boston and Plymouth, and then decreases between Plymouth and Barnstable. At the end of the simulation, net erosion has occurred along the crest of Stellwagen Bank and Jeffreys Ledge, along the western shore of Massachusetts Bay north of Plymouth, in eastern Cape Cod Bay, and along the outer arm of Cape Cod, reaching maximum values of 0.05 m. Deposition occurs south of Cape Ann, in eastern Stellwagen Basin immediately west of Stellwagen Bank, and in Cape Cod Bay in a band extending from the Cape Cod Canal to Provincetown. A region of deposition occurs south of Plymouth; this depositional area results from the material eroded and transported from the area north of Plymouth, and may eventually erode as the upstream source is reduced.
The qualitative agreement between the present distribution of sediments and the model results is consistent with the hypothesis that sediment transport caused by northeast storms plays a key role in determining the sediment distribution in Massachusetts Bay. Mixtures of sediment introduced into the system would be resuspended, sorted, and deposited according to these patterns. However, the present sediment distribution also reflects the glacial history of the region which involved the transport and deposition of very large grain sizes little affected by Northeast storms.
Pathways of sediment transport caused by northeast storms
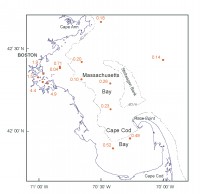
The metal silver, introduced from the photo-processing industry, is an ideal tracer for sewage effluent because of low natural background concentrations. Concentrations of silver in the surficial sediments are highest in Boston Harbor (in excess of 4 ppm in some areas) and decrease offshore to background concentrations of 0.14 - 0.18 ppm to the east of Stellwagen Bank in the Gulf of Maine (Ravizza and Bothner, 1996) (Figure 6.6). Immediately offshore of Boston, silver concentrations of 0.7 ppm are found in small areas of fine-grained sediments. Silver concentrations are about 0.5 ppm in Cape Cod Bay and 0.20 - 0.26 ppm in Stellwagen Basin, suggesting alongshore and offshore transport to these depositional sites from the Boston source. The distribution of silver in the surface sediments reflect loadings and transport processes occurring over the last 100 years. The sediment transport model can be used to explore the role of northeast storms in transporting silver to the depositional sites in Stellwagen Basin and Cape Cod Bay.
In 1985 the Massachusetts Water Resources Authority (MWRA) was established to clean up pollution in Boston Harbor resulting from the long-term discharge of untreated sludge and sewage effluent. Elimination of the discharge of sewage sludge, addition of secondary treatment, and moving the discharge of treated effluent to a new ocean outfall 9.5 miles offshore in Massachusetts Bay (in deeper water and away from the coast, see Figure 1.5) has resulted in improved water quality in Boston Harbor and no apparent change in Massachusetts Bay, as predicted (Signell and others, 2000, see Section 5). Although the loading of solids and metals has been reduced by a factor of 4 and 6, respectively, since 1990 (Werme and Hunt, 2004), it is of interest to use the sediment transport model to explore the long-term fate of particles introduced into Boston Harbor with particles introduced into western Massachusetts Bay.
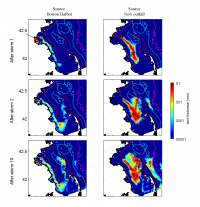
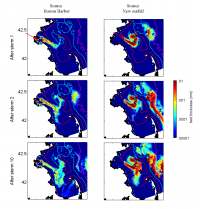
Simulations of the transport of fine-grained material from Boston Harbor and from western Massachusetts Bay during idealized northeast storm conditions show transport into Cape Cod Bay and Stellwagen Basin. Under winds from 12° (Figure 6.7a), material from Boston Harbor is carried in a narrow band along the coast southeastward toward Cape Cod Bay; some material is carried northward by bottom currents opposite to the direction of the wind, reaching Stellwagen Basin. Material from the new outfall site travels southeastward, then offshore into Stellwagen Basin. After 10 storms, some material from both sites escapes Massachusetts Bay into the Gulf of Maine. Under winds from 50° (Figure 6.7b), material from the Boston Harbor site moves southeastward, offshore into Stellwagen Basin, and into the Gulf of Maine; transport to Cape Cod Bay is weaker than under winds from the north. Material introduced at the new outfall site follows a similar path, but does not enter Cape Cod Bay. Even after one storm, some material escapes to the north of Stellwagen Bank and into the western Gulf of Maine.
The modeled transport pathways of sediments from Boston Harbor are consistent with Boston being the long-term source of silver found in the surficial sediments in Cape Cod Bay and Stellwagen Basin. Storms with winds from 0 to about 60° cause southeastward transport toward Cape Cod Bay in a nearshore band along the western side of Massachusetts Bay, and northward into Stellwagen Basin. Storms with winds from 60° or greater cause near-bottom flow directly offshore into Stellwagen Basin. Physical or biological vertical mixing of sediments deposited on the seafloor after each storm would bury them in the sediment column and make them less available for resuspension by subsequent storms, efficiently sequestering the silver in the bottom sediments. It is tempting to attribute the higher silver concentrations in Cape Cod Bay relative to Stellwagen Basin to the alongshore transport under winds from the north, or because transport pathways to Stellwagen Basin go through Cape Cod Bay. However, the observed distribution of silver in the surficial sediments reflects the cumulative transport caused by a sequence of storms with a variety of wave and wind characteristics, the spatial and temporal history of the discharge of silver into the Massachusetts Bay system over the last 100 years or so, and mixing of sediments into the sediment column.
The northeast storms used in these model simulations are some of the largest observed in the 13-year wave record from 1989 - 2002. Storms with weaker winds would drive similar circulation patterns, but the waves, responsible for most of the sediment resuspension, also would be weaker and thus resuspend sediments less frequently in Stellwagen Basin (too deep) and Cape Cod Bay (sheltered from the east). Thus even small northeast storms would transport sediment along the shallower portions of the transport pathways to depositional sites, but only from water depths where the waves are strong enough to resuspend sediments.
Table 6.1. Top ten storms from 1990-2002, based on excess wave bottom stress above sediment transport threshold at 30 m calculated from wave observations at NOAA Buoy 44013. The two largest storms were the December 11, 1992 'Blizzard of '92' and the 'Halloween Storm' or 'Perfect Storm' of October 28, 1991. Wind speed and direction are the vector-averaged wind speed for the period of the storm where wind stress was greater than 0.2 N/m² (11.5 m/s), SWH is significant wave height, Ub is the wave current at 30 m, and IES is proportional to excess wave stress, integrated over the storm, at 30 m water depth. The IES is used to rank the storms.
|
Click on figures below for larger images (PDF format).
 | Figure 6.1.
|
 | Figure 6.2.
|
 | Figure 6.3.
|
 | Figure 6.4.
|
 | Figure 6.5.
|
 | Figure 6.6.
|
 | Figure 6.7a.
|
 | Figure 6.7b.
|
|