|
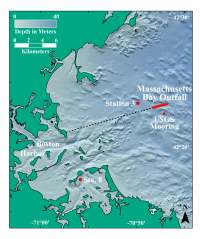
On September 6, 2000, the discharge of 380 million gallons of secondary treated sewage per day was switched from outfalls at the mouth of Boston Harbor to a new outfall 15.2 km to the east in Massachusetts Bay (Figure 7.1.). This significant step in the $4- billion Boston Harbor cleanup program was accomplished after considerable public debate (Gelbspan, 1991; McLaughlin, 1992) and legal challenges based on fears that the Massachusetts Bay outfall would transfer Boston's pollution problems to the shores beyond Boston Harbor and threaten the whales on Stellwagen Bank. The USGS played a key role in the public debate by providing unbiased scientific predictions based on numerical models that showed the path of the effluent plume. Model predictions indicated that the new outfall would result in a cleaner harbor without adversely impacting the environments of Massachusetts and Cape Cod Bays. Testing this prediction became an important scientific and legal objective; monitoring the levels of contaminants in the bay and harbor sediments became one of the primary testing criteria.
As part of the comprehensive outfall monitoring plan for Massachusetts Bay, the USGS has been measuring the chemical composition of bottom and suspended sediments near the site of the Massachusetts Bay Outfall since 1989 (Figure 7.1., Station 3). The first objective was to establish a pre-outfall baseline in order to determine the magnitude, cause, and possible consequences of any chemical changes in sediments as the new outfall continues operation. The variables measured include heavy metal concentrations (silver, copper, lead, etc.), sediment texture, and concentrations of Clostridium perfringens, a chemically resistant bacterial spore that is found in sewage (Buchholtz ten Brink and others, 2000). This report evaluates the change in chemical composition and properties of sediment over time with respect to improvements in the waste processing system in Boston.
Bottom sediment time-series:
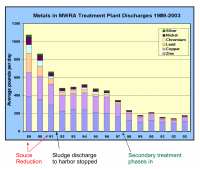
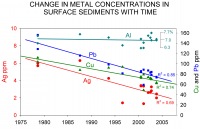
Silver (Ag) is emphasized in this report because it is a sensitive, inorganic chemical tracer for sewage particles in marine sediments and suspended matter (Bothner and others, 1994). Its concentration is elevated in sewage because of its use and discharge by the photographic, health care, electronics, and electroplating industries. In 1980, Boston's sewage sludge contained 55 ppm Ag (dry weight) on average, about 1000 times higher than is found in uncontaminated fine-grained marine sediments. The discharge of Ag from Boston's sewage treatment facility has decreased (Figure 7.2.) from 18 lbs/day in 1990 to 1.2 lbs/day in 2004 (M. Hall, MWRA, written communication 6/10/05). This decrease was accomplished by stopping sludge discharge to the harbor in 1991, by strictly enforcing industrial discharge limits for Ag, and by upgrading to secondary sewage treatment. Since 1990, a significant decrease in the discharge of other metals has also been documented (Figure 7.2.).
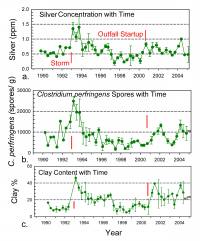
Station 3 (Figure 7.1.) was selected as a monitoring station because a side-scan sonar mapping and sampling survey of the seabed identified it as the closest region to the proposed outfall site where muddy sediment exists in a topographic depression about 1 km² in area (Bothner and others, 1992; Butman and others, 2003a, b, c). In this section we summarize the results of analyses for Ag, C. perfringens, and clay determined on the surfaces (0-0.5 cm) of sediment cores collected at the monitoring station between 1989 and early 2005 (Figure 7.3.). Key events in the time-series are an exceptionally large storm in December 1992 and the start of flow from the outfall in September 2000.
Between 1989 and mid-October 1992, the concentrations of Ag in surface sediments at Station 3 were between 0.4 ppm and 0.8 ppm (considerably above background levels of 0.03-0.05 ppm). Ag then increased more than twofold prior to the next sampling cruise in February 1993 (Figure 7.3a.). Similar changes were measured in spore counts of C. perfringens (Figure 7.3b.) and clay content (Figure 7.3c.). The concentrations of these constituents remained elevated for about a year.
The best explanation for the increase in Ag and C. perfringens that occurred between September 1992 and February 1993 is that fine-grained sediment, containing elevated concentrations of these sewage indicators, was resuspended and transported from inshore areas and deposited in deeper local depositional areas offshore, such as Station 3 (Bothner and others, 2002). The driving force for this redistribution was an unusually strong, slow-moving northeast storm, from December 11-16, 1992 that generated 7.3-m high waves at the study site. Large storms from the northeast typically cause resuspension and offshore bottom currents at this location (Butman and Bothner, 1997; Signell and List, 1997).
This long time-series of pre-outfall data for surface sediments is important because it defines the range of change in concentration that can result from natural processes. Had the outfall begun operation in January of 1993, one might have incorrectly assumed that the new outfall was responsible for the observed increase in Ag and C. perfringens concentrations.
The main conclusion from the post-outfall concentrations of silver, as well as other trace metals and C. perfringens (Figure 7.3a-c.), is that no significant increases were observed compared to the average pre-outfall values at the 95% level of confidence. The increases following the major storm in December 1992, when contaminated fine-grained sediments were transported to the monitoring station, represent the largest changes in sewage indicators during the 15-year study period.
It is of interest to point out that during the 3-year period immediately before outfall startup (1997-2000), we measured relatively lower values of Ag, C. perfringens and % clay than in the post-outfall samples. Clay normalization (the ratio of Ag to % clay and C. perfringens to % clay) was used to correct for the commonly found influence of the fine sediment percentage on the metal content of bulk sediments. Plots of clay-normalized values reveal no differences throughout the period between 1997 and 2004 and reinforce the conclusion that there are no outfall-related increases in Ag and C. perfringens observed in bottom sediments.
Trapped sediment time-series:
Sediment traps were used to collect suspended sediment at our long-term mooring station located about 1 km south of the outfall (
Figure 7.1.). Analysis of material collected with sediment traps may be a more sensitive method for identifying outfall-related chemical changes than analysis of surficial bottom sediment. Unlike bottom sediments that are continuously mixed and diluted with older sediment of different composition by benthic organisms (Wheatcroft and others, 1994), particles collected in sediment traps are isolated from such mixing and potential dilution. One limitation of sediment traps located in shallow coastal waters is that they do not measure the net vertical flux of material to the sea floor. The rate of collection is dependent upon a complicated set of variables that includes: trap design, current speed, sediment fall velocity (Baker and others, 1988; Butman, 1986), as well as the frequency and magnitude of sediment resuspension (Gardner and others, 1983). The re-deployment of traps of the same design in the same place, however, preserves the ability to compare concentrations of sewage tracers in trapped sediment collected under similar oceanographic conditions before and after the start of a new waste delivery system.
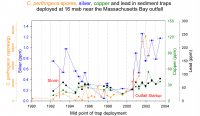
Results from the trap placed at the highest elevation (16 mab - meters above bottom) are summarized here. This trap optimizes sensitivity for detection of sewage particles for two reasons. First, because of its height above bottom, this trap has the lowest fraction of material resuspended from the sediment surface that can dilute particles originating from the outfall plume. Second, the trap is a few meters below the seasonal pycnocline, which impedes the upward mixing and maintains the top of the sewage plume close to the trap elevation.
Of the suite of metals analyzed from these trap samples, only Ag has been shown to have a statistically higher concentration (p=0.05) in post-outfall samples (0.92 ppm ± 0.25 ppm) compared to pre-outfall values (0.42 ppm ± 0.25 ppm, Figure 7.4.). The concentrations of Ag were between 0.5 and 1.0 ppm in the early 1990s with the exception of one high value (not plotted) that appears to result from spurious sample contamination. Concentrations are lowest during the late 1990's when, coincidentally, the discharge of Ag and other metals through the outfall at the harbor mouth was decreasing as secondary sewage treatment was phased in beginning in 1997. The highest concentration of Ag in post-outfall samples was 1.2 ppm, well below the 3.7 warning level established for bottom sediments by MWRA's outfall monitoring program.
C. perfringens also increased post-outfall (Figure 7.4.). While the concentrations of C. perfringens spores in the 16 mab trap during the pre-outfall period are between 1000 and 16,000 spores/g, concentrations increased beginning at the time of outfall startup and rose to a maximum of 73,000 spores/gram in the post-outfall data that are presently available.
There are no systematic changes in the concentrations of Cu or Pb during the pre-outfall period and no significant changes in the post-outfall concentrations of these metals. The overall average concentrations of Cu and Pb are 26 ± 10 ppm and 58 ± 14 ppm, well below the warning levels for sediments of 270 ppm and 218 ppm, respectively.
It is worth noting that these warning levels (equivalent to the ERM (effects range - medium) values of Long and others, 1995)) are based on studies with bottom sediments. Trapped sediments typically have higher proportions of fine-grained particles and organic carbon, and higher concentrations of metals than surficial bottom sediments from the same region. Comparing the concentration of metals in trapped sediment to the warning criteria is thus a conservative application of the criteria, which none of the metals exceeded.
The clear post-outfall increase in C. perfringens and Ag permits a rough estimate of how the new outfall has contributed more particulates to the area monitored by the sediment trap. There are only two measurements of C. perfringens in final effluent from the new Deer Island Sewage Treatment Plant. The average value is 5100 spores/ ml, which is equivalent to 4.6 X 10⁶ spores/gram dry weight, assuming that the spores are part of the total suspended solids load (unpublished data from M. Hall, MWRA, 2004). Taking these estimates as representative, the observed increase could be explained if 1% of the settling particles was derived from the outfall. An additional and important assumption is that the particles in the effluent plume (about 16 mg/l) behave in the ocean in the same manner as the natural particulate matter (present at 1-2 mg/l). A similar preliminary estimate of sewage-particle contribution can be made with the silver data. Estimated concentrations of Ag in particulates of the final effluent are 25 ug/g ± 16 ug/g (unpublished data from M. Hall, MWRA, 2004). The average observed increase in silver concentrations (using a 3-year pre-outfall average) could be explained if 3% of the material trapped originated from the outfall. These estimates have large uncertainties but they seem reasonable given that the effluent dilution model (Signell and others, 2000) indicates the 3-year average plume concentration is about 1% at the trap location.
Decreasing concentrations of metals in harbor sediments:
Since 1977 the USGS has periodically measured metal concentrations in surface sediments of Boston Harbor. The recent data from the most frequently sampled station in the south harbor (Station 8, Figure 7.1.) confirms previous trends (Bothner and others, 1998) that metal concentrations are decreasing with time. Compared to the concentrations at the start of the harbor study, the concentrations have decreased on average about 50% during the past 25 years (Figure 7.5.). In that time there have been significant decreases in the inputs of metals to the harbor. Removal of Pb from gasoline has reduced the atmospheric deposition of Pb globally. Specific to Boston, strict enforcement of discharge regulations for industries, stopping sludge discharge to the harbor, implementing secondary sewage treatment, and moving the outfall have been significant steps in reducing metal inputs.
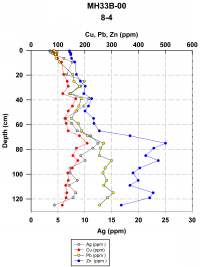
Although the surface sediments are becoming less contaminated, long sediment cores reveal very high concentrations beneath the sediment surface that remain as a potential source of contamination after the primary sources are reduced or eliminated (Figure 7.6.). Maximum concentrations of Ag (12 ppm) and Pb (310 ppm) and Zn (500 ppm) at depth in the core from station 8 are higher than the ERM guidelines (Long and others, 1995) for toxicity to benthic animals. Based on assigning an age of 1963 to the depth of a subsurface maximum in the activity of 137Cs, the highest concentrations of metals at this location were deposited about 1945, a time when war-related ship building activities in Boston Harbor were ending (Bothner and others, 1998; Bergeson, 1993). We are conducting new studies with colleagues at WHOI to determine the rates and processes by which these metals can be recycled between particulate and dissolved phases within the upper sediment column. The continuing work documents that these metals can be released into the overlying water by diffusion, advection of pore water, and/or by particulate resuspension and desorption (See Section 10 by Martin and Kalnejais). This information will be an important contribution to our understanding of the long-term fate and effects of contaminants in coastal sediments.
Conclusions:
The Massachusetts Bay Outfall has had minimal impact on the concentrations of toxic metals in nearby sediments. The average concentrations of C. perfringens, Ag, and other metals in bottom sediments collected at station 3 (2.5 km west of the outfall) after the outfall startup (September 6, 2000) are statistically no different than values measured in pre-outfall samples at the 95% level of certainty.
Post-outfall sediment trap samples collected 16 meters above bottom have higher concentrations of C. perfringens and Ag than pre-outfall samples. The highest concentrations of Ag are well below warning guidelines. Toxicity guidelines for C. perfringens spores in sediment have not been found in a literature search. Based on preliminary estimates, the enrichments of Ag and C. perfringens can be explained if 1-3% of the total sediments collected by the traps are derived from the sewage effluent. The effluent dilution model indicates that the average plume concentration is about 1% at the location of this trap. An assumption in this comparison is that natural and sewage-derived particles have the same efficiency for collection by traps.
The major storm in December 1992 caused a twofold increase in the concentrations of C. perfringens and silver at Station 3, presumably by transporting fine-grained sediment from inshore locations to this long-term monitoring site near the planned location of the Massachusetts Bay Outfall. This result demonstrates that knowledge of how natural physical processes can affect contaminant concentrations is important for correct interpretation of changes that may occur, now that the Massachusetts Bay Outfall is operational.
The concentrations of metals in surface sediments of Boston Harbor are decreasing with time since the late 1970s in response to decreases in metal inputs. The average decrease of Ag, Cu, and Pb over the past 25 years at station 8 was about 50%. Subsurface sediments in some areas of Boston Harbor have metal concentrations that exceed toxicity guidelines. These represent a potential source of contamination that can continue after the primary sources are reduced or eliminated. Processes and rates of reintroduction from deeper sediments are under continuing investigation.
|
Click on figures below for larger images (PDF format).
 | Figure 7.1.
|
 | Figure 7.2.
|
 | Figure 7.3a,b,c.
|
 | Figure 7.4.
|
 | Figure 7.5.
|
 | Figure 7.6.
|
|