|
|
|
|
|
| Report Home | Maps | Overview | Mapping Methods | Coastal Classifications | Geologic Setting | Coastal Processes | Coastal Vulnerability | Classification Summary | References | |||||||||||||||||||||||||||||||
Mapping MethodsA coastal storm-hazard assessment involves two different activities. The first is classification of ground conditions, and the second is translation of that information into a storm hazard-vulnerability index. Present ground morphology and any man-made land alterations were first interpreted in the laboratory, using three independent visual sources:
The video tapes and slides are oblique low-altitude photographs of the beach obtained during helicopter surveys with horizontal positions determined by a Global Positioning System (GPS). Dates of the various surveys are presented in Table 1.
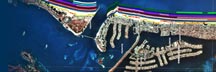
The video surveys, slides, and DOQQs were used to prepare the coastal classification units (Fig. 2) and to interpret the geomorphological and urban attributes of each coastal segment. Elevations of the land surface adjacent to the barren backbeach were obtained by processing lidar (light detection and ranging) data. The highest elevations of the dunes or beach crest (where dunes are absent) are shown as a series of dots. Each dot is color coded to represent a narrow range of elevations. The units of elevation are decimeters, or tenths of meters. |
|||||||||||||