 |
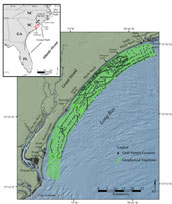
Figure 1. Location map of the study area showing geophysical tracklines and surficial grab sample locations. Inset map shows major water bodies, coastal landforms, and the regional orientation and axis of the Mid-Carolina Platform High (MCPH). The background shaded relief imagery is a digital elevation model of the northeastern South Carolina coastal plain (NOAA-NGDC, 2001).
Click on figure for larger image and full caption.
|
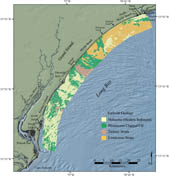 |
Figure 2. Surficial geologic map of the study area based on Baldwin and others (2004). The inner shelf consists of exposures of Cretaceous and Tertiary strata, Pleistocene channel-fill deposits, and discontinuous deposits of modern sediment. The background shaded relief imagery is a digital elevation model of the northeastern South Carolina coastal plain (NOAA-NGDC, 2001).
Click on figure for larger image and full caption.
|
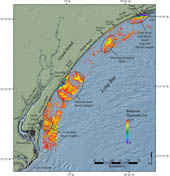 |
Figure 3. Map showing the thickness of modern sediment within the study area. Sediment thickness was mapped through interpretation of chirp seismic reflection data. Inlet shoal complexes and shore-detached shoals are outlined. Thicknesses are reported in meters (assuming a velocity of 1500m/sec). Areas where the sea floor bathymetry is visible indicate areas of surficial sediment < 0.5 m thick. Figure modified from Baldwin and others (2004, their figure 17). The background shaded relief imagery is a digital elevation model of the northeastern South Carolina coastal plain (NOAA-NGDC, 2001).
Click on figure for larger image and full caption.
|
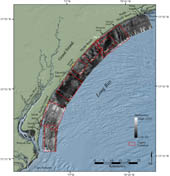 |
Figure 4 Sidescan-sonar image of the study area and figure locations. High backscatter is represented as light tones within the imagery, low-backscatter is represented by dark tones.
Click on figure for larger image and full caption.
|
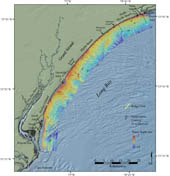 |
Figure 5. Map showing the bathymetry within the study area. Contour interval is 1 m. Ridge crests are displayed. Location of shoreface profiles A-A' and B-B' in figure 6 are displayed. Depth in the study area ranges from 2 to 14 meters. The background shaded relief imagery is a digital elevation model of the northeastern South Carolina coastal plain (NOAA-NGDC, 2001).
Click on figure for larger image and full caption.
|
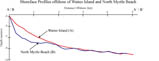 |
Figure 6. Bathymetric profiles across the shoreface and inner shelf of Long Bay. Figure 4 identifies the location of profile transects. A) The smooth shoreface offshore of Waites displays a gentle slope due to influence of the inlet shoal complex associated with Little River Inlet. B) The more irregular shoreface offshore of North Myrtle Beach is steeper where it lies outside the influence of the inlet shoal complex.
Click on figure for larger image and full caption.
|
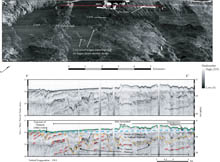 |
Figure 7. Sidescan-sonar imagery and chirp seismic-reflection profile across the inlet shoal complex offshore of Murrells Inlet. See figure 4 for figure location. Top: Perspective view of sidescan-sonar imagery draped over bathymetry, showing shore-oblique, low-relief ridges and the crest of the larger shore-normal shoals. Bottom: Chirp seismic-reflection profile shows the shoal complex overlying the transgressive surface, which truncates Pleistocene channels (yellow) and Cretaceous strata (red). Depth is approximate and assumes a seismic velocity of 1500 m/sec. Figure modified from Baldwin and others (2004, their figure 13).
Click on figure for larger image and full caption.
|
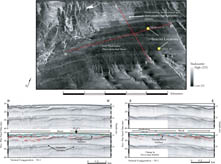 |
Figure 8. Sidescan-sonar imagery and chirp seismic-reflection profiles on the inner shelf offshore of northern Myrtle Beach. See figure 4 for figure location. Top: Perspective view of sidescan-sonar imagery draped over bathymetry showing the low-backscatter, shore-oblique shoal and adjacent high-backscatter areas. A complex pattern of shore-normal and shore-parallel high-backscatter lies directly shoreward of the shoal. Yellow circles denote core locations: see Appendix B for core descriptions. Bottom: Chirp seismic-reflection profiles across shoal show the thickness of sediment associated with the shoal (area between green and blue), and the transgressive surface (blue) and truncated Cretaceous strata underlying the shoal (red). Depth is approximate and assumes a seismic velocity of 1500 m/sec. Figure modified from Baldwin and others (2004, their figure 18).
Click on figure for larger image and full caption.
|
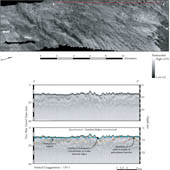 |
Figure 9. Sidescan-sonar imagery and chirp seismic-reflection profile on the inner shelf. Sidescan-sonar imagery draped over bathymetry, showing the moderate to high backscatter ridges characteristic of the area. Bottom: Chirp seismic-reflection profile shows ridges of modern sediment with the transgressive surface (blue) exposed in the trough. Depth is approximate and assumes a seismic velocity of 1500 m/sec. Figure modified from Baldwin and others (2006, their figure 20).
Click on figure for larger image and full caption.
|
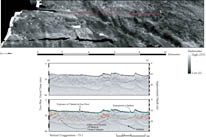 |
Figure 10. Sidescan -sonar imagery and chirp seismic-reflection profile on the inner shelf offshore of North Island. See figure 4 for figure location. Top: Perspective view of sidescan-sonar imagery draped over bathymetry, showing the moderate to high backscatter ridges characteristic of the area. Bottom: Chirp seismic-reflection profile shows large, asymmetric ridges of modern sediment with steeper sides facing south, and the transgressive surface (blue) exposed in the swales. Depth is approximate and assumes a seismic velocity of 1500 m/sec. Figure modified from Baldwin and others (2006, their figure 3 in Data Repository).
Click on figure for larger image and full caption.
|
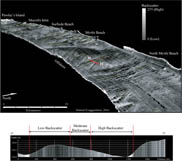 |
Figure 11. Top: Perspective view of sidescan-sonar imagery draped over bathymetry looking towards the southwest. Yellow lines indicate the crests of low-relief ridges. Vertical exaggeration is 200 x. Bottom: Shore-parallel bathymetric profile across a characteristic low-relief ridge showing variation in backscatter in relation to ridge morphology. High-backscatter covers the trough and NE side of the ridge, and moderate to low backscatter covers the crest and SW side. Depth is in meters. Distance is in kilometers. Note asymmetry of ridge with steeper slope facing to the southwest.
Click on figure for larger image and full caption.
|
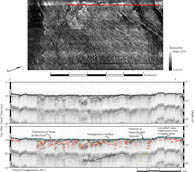 |
Figure 12. Sidescan-sonar imagery and chirp seismic-reflection profile on the inner shelf offshore of Surfside Beach. See figure 4 for figure location. Top: Perspective view of sidescan-sonar imagery draped over bathymetry, showing the complex patterns of high backscatter characteristic of the area. Bottom: Chirp seismic-reflection profile showing thin to absent modern sediment and the transgressive surface (blue) exposed at the sea floor. Depth is approximate and assumes a seismic velocity of 1500 m/sec. Figure modified from Baldwin and others (2004, their figure 9).
Click on figure for larger image and full caption.
|
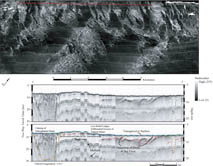 |
Figure 13. Sidescan-sonar imagery and chirp seismic-reflection profile directly offshore of Myrtle Beach. See figure 4 for figure location. Top: Perspective view of sidescan-sonar imagery draped over bathymetry, showing the complex patterns of high and low backscatter characteristic of the area. Low-relief, shore-normal ridges are displayed in the nearshore. Bottom: Chirp seismic-reflection profile directly offshore of Myrtle Beach. Profile displays Pleistocene channels (yellow) and Cretaceous strata (red) exposed at the sea floor and differential erosion of outcropping Cretaceous strata. Transgressive surface (blue) and sea floor are outlined (green). Vertical scales show milliseconds (Two-way travel time) and approximate depth assuming a seismic velocity of 1500 m/sec. Figure modified from Figure 12, Baldwin and others (2004).
Click on figure for larger image and full caption.
|
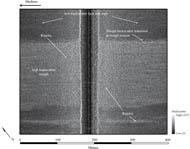 |
Figure 14. Sidescan-sonar image displaying the wave-orbital ripples within the high-backscatter shore-perpendicular lineations offshore of Myrtle Beach. Low backscatter crests and abrupt backscatter transitions at the trough margins are displayed. See figure 4 for figure location.
Click on figure for larger image and full caption.
|
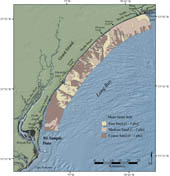 |
Figure 15. Map showing the mean grain size of surficial sediments in the study area. No sample data were available for the area south of North Inlet.
Click on figure for larger image and full caption.
|
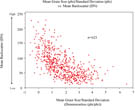 |
Figure 16. Plot showing mean grain size/standard deviation versus mean backscatter for surficial sediment samples collected within the study area. No statistically significant correlation exists between variables. Backscatter values were extracted from the sidescan-sonar imagery in a 10-m radius around sample location. Samples falling on backscatter transitions were excluded from analyses (99 out of 722).
Click on figure for larger image and full caption.
|
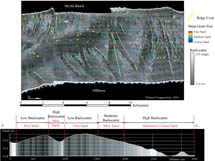 |
Figure 17. Top: Perspective view of sidescan-sonar imagery draped over bathymetry looking towards Myrtle Beach. Mean grain size of samples is indicated by color-coded spheres. Vertical exaggeration is 200 x. Bottom: Shore-parallel bathymetric profile along a characteristic low-relief ridge showing variations in backscatter and mean grain size of surficial sediment in relation to ridge morphology. Finer sediments fall on the crest and SW side of low-relief ridges; coarse grained sediments fall on NE side and within the trough.
Click on figure for larger image and full caption.
|
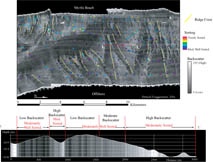 |
Figure 18. Top: Perspective view of sidescan-sonar imagery draped over bathymetry looking towards Myrtle Beach. The degree of sorting of surficial sediment samples is indicated by color-coded spheres. Vertical exaggeration is 200 x. Bottom: Shore-parallel bathymetric profile along a characteristic low-relief ridge showing variations in backscatter and sorting in relation to ridge morphology. Sorting improves moving from the NE side and trough to the crest and SW side.
Click on figure for larger image and full caption.
|
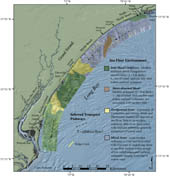 |
Figure 19. Map showing the four primary sea floor environments within Long Bay: inlet shoal complexes, shore-detached shoals, hardground and transition areas, and inferred sediment transport pathways based on seabed morphology and surficial textural distribution.
Click on figure for larger image and full caption.
|
|
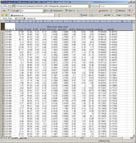 |
Appendix A. Textural properties of grab samples collected within the survey area 2000 - 20002 by Coastal Carolina University. Table shows percent gravel, sand, silt, clay, mean grain size (mm), mean grain size (phi), sorting, skewness, kurtosis, longitude and latitude of sample locations.
Microsoft Excel Document. Microsoft Excel required. (www.microsfoft.com)
Click on folder icon to open Appendix A. Right click and ' Save Target As...' to save file to local disk.
|
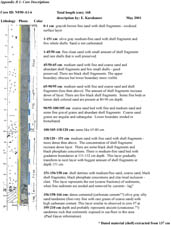 |
Appendix B1. Descriptive logs of two cores collected from the shoreface-detached shoal offshore of Myrtle Beach. See figure 6 for core locations. Shell and organic material were extracted from the cores and submitted for C-14 dating, yielding Holocene age of the shore-oblique shoal (Gayes, pers. comm.). Cores were described by E. Karbabanov May and August 2001.
Click on figure for larger image and full caption.
|
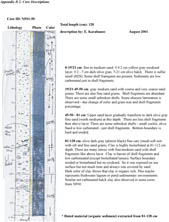 |
Appendix B2. Descriptive logs of two cores collected from the shoreface-detached shoal offshore of Myrtle Beach. See figure 6 for core locations. Shell and organic material were extracted from the cores and submitted for C-14 dating, yielding Holocene age of the shore-oblique shoal (Gayes, pers. comm.). Cores were described by E. Karbabanov May and August 2001.
Click on figure for larger image and full caption.
|

 Back to Previous Section
 Forward to Next Section