Open-File Report 2005–1423
INTRODUCTIONRadon was first recognized in 1898 by Fredrich Ernst Dorn (Bentor, 2005). Centuries before that Agricola noted frequent deaths from respiratory disease among underground metal miners in the Erz Mountains of eastern Europe (Hoover and Hoover, 1950) but it was not until 1988 that radon was classified as a human carcinogen (International Agency for Research on Cancer, 1988). In 1984 radon in the United States became a hot topic after a home in eastern Pennsylvania was found to have indoor radon concentrations as high as 2,600 picoCuries per liter (pCi/L) (Abate, 1992). Following that discovery, the U.S. Department of Energy (USDOE) and the U.S. Environmental Protection Agency (USEPA) began research programs designed to improve knowledge about the occurrence and risks of indoor radon. Many of the publications of that research as well as other research efforts have been summarized and discussed (Committee on Health Risks of Exposure to Radon, 1999; UNSCEAR, 2000). The USEPA developed maps that show expected average indoor radon concentrations by state and county. According to the USEPA, "The Map was developed using five factors to determine radon potential: indoor radon measurements; geology; aerial radioactivity; soil permeability; and, foundation type. Radon potential assessment is based on geologic provinces. Radon Index Matrix is the quantitative assessment of radon potential. Confidence Index Matrix shows the quantity and quality of the data used to assess radon potential. Geologic Provinces were adapted to county boundaries for the Map of Radon Zones." The USEPA radon zone maps are categorized by counties as zones 1, 2, or 3. In zone 1 the average indoor radon concentrations is expected to be greater than 4 picoCuries per liter (pCi/L). In zone 2, it is expected to be between 2 and 4 pCi/L and in zone 3, it is expected to be less than 2 pCi/L. Figure 1 (below) shows the radon zone map for Texas. Field and others (2000) studied the risk of lung cancer for exposure to low levels of radon and found evidence of increased risk at levels as low as 4 picoCuries per liter (pCi/L) which suggests that identification and mitigation of .homes with 4 pCi/L or more of indoor radon would reduce the risk of lung cancer. The characterization of radon risk on a county basis has several issues that suggest that it is an inappropriate approach. One problem is that indoor radon distributions are closer to lognormal than to normal distributions which means that the mean value is a poor metric. The reason that the mean value is a poor metric is that lognormal distributions are highly skewed and asymmetric. A second issue is the fact that specific geologic units are more likely than others to produce radon in soil gas and thus pose a higher risk for indoor radon. Such geologic units are generally much smaller than a typical county and large areas of a county might be at much lower risk. Characterizing a county by a single risk factor can result in seriously underestimating the risk in localized areas. Churchill (2005) reports that indoor radon measurements in homes sited on marine shale in Los Angeles County, California ranged as high as 37 picoCuries per liter (pCi/L) and in one particular area more than 30 percent of the tested homes had radon levels greater than 4 pCi/L. Some of the indoor radon measurements in Los Angeles County were greater than 100 pCi/L (Churchill, 2005) yet the USEPA radon hazard ranking for Los Angeles County is level 2. In fact the data analyzed by Churchill (2005) indicates that the USEPA ranking is correct according to their ranking method but it completely fails to represent the much higher risk for selected parts of the county. A third issue is the fact that the USEAP ranking approach relies heavily on indoor radon data and makes only limited use of the physical properties of the geologic materials. An alternative approach would seek to identify potentially hazardous materials regardless of whether the hazard has already been realized. This study looks at part of the southern Rio Grande Valley where all of the counties are ranked by USEPA as zone 3. The study area (see index map) includes parts of Cameron, Hidalgo, and Willacy Counites all of which are shown as zone 3 in Figure 1. High-resolution airborne gamma-ray data from Duval (2005) as well as regional data in Duval and Riggle (1999) indicate that specific geologic units within the study area have uranium concentrations greater than 3 ppm eU. The geologic units in question are mapped by Page, VanSistine, and Turner (2005) as Holocene floodplain deposits of the Rio Grande and as members of the Beaumont Formation. This study examines whether the geologic units with higher uranium concentrations have more potential for indoor radon than other geologic units within the study area. 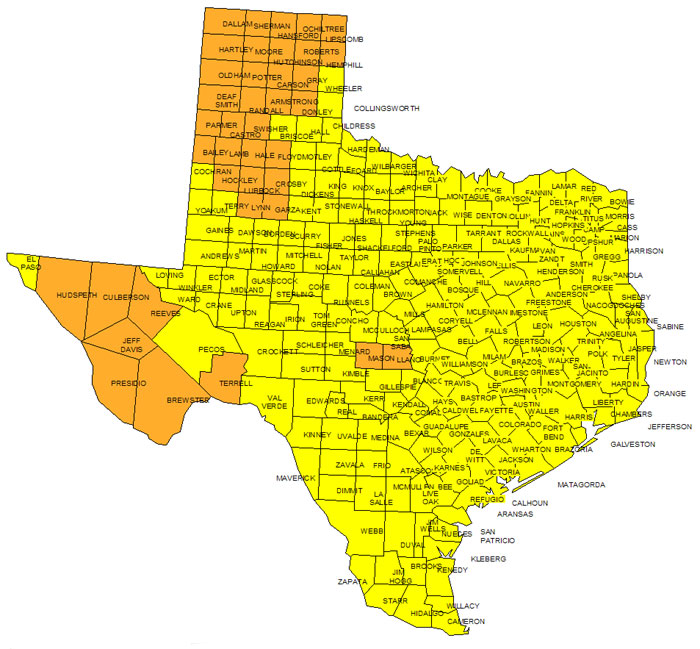
Figure 1. Radon zone map of Texas (from the USEPA web site, March 31, 2005). The yellow-colored counties are zone 3 and the orange-colored ones are zone 2. As of March 31, 2005, the USEPA had not ranked any counties in Texas as zone 1. |
First posted December 14, 2005 This report is presented in HTML. Main headings are listed below.
For additional information contact: Part or all of this report is presented in Portable Document Format (PDF); the latest version of Adobe Reader or similar software is required to view it. Download the latest version of Adobe Reader, free of charge. |
Duval, J.S., 2005, Radon in soils of parts of Cameron, Hidalgo, and Willacy Counties, Texas: U.S. Geological Survey Open-File Report 2005–1423, available online only at http://pubs.usgs.gov/of/2005/1423/.

![]() U.S. Department of the Interior |
U.S. Geological Survey
U.S. Department of the Interior |
U.S. Geological Survey
URL: http://
pubsdata.usgs.gov
/pubs/of/2005/1423/index.htm
Page Contact Information: USGS Publications Team
Page Last Modified: Saturday, 12-Jan-2013 21:49:23 EST
