U.S. Geological Survey Open-File Report 2005-1428
Digital Mapping Techniques '05—Workshop Proceedings
1Virginia DMME-Division of Mineral Resources,
900 Natural Resources Dr. Suite 500,
Charlottesville, VA 22903
Telephone: (434) 951-6343;
Fax: (434) 951-6366;
e-mail: elizabeth.campbell@dmme.virginia.gov
2Texas Bureau of Economic Geology, John A. & Katherine G. Jackson School of Geosciences, The University of Texas at Austin, University Station, Box X, Austin, TX 78713-8924
An analysis was performed to evaluate the frequency of blunders that resulted from the use of multiple transfer sheets to compile a printed geologic map from field maps. Point data from field maps were compared to the corresponding final published map for five quadrangles. The blunder rate ranged from 0.46% to 15.99%. The most frequent blunder was using the wrong symbol for bedding measurements, followed by an error in the dip number. Blunder analysis yielded insight regarding the approximate percentage of measured geologic points that are possibly misrepresented on any given published geological map that was created using traditional publication procedures and techniques.
The Virginia Division of Mineral Resources has made a digital compilation of the geology of fifteen quadrangles along Interstate 81 in the central Shenandoah Valley of Virginia (Figure 1) as part of the USGS STATEMAP program. The goal of the project was to create a digital mosaic of the geologic information that could be used by counties, state agencies, and other stakeholders for planning and management purposes. A comprehensive digital collection of geologic field data, particularly point data, facilitates the integration of geologic information into the decision making process. Additionally, the compilation enables the study of large geologic structures that are not fully expressed in the area of a single 7.5-minute quadrangle.
Figure 1. Location map showing the area of study in Virginia.
Geologic maps of twelve of the quadrangles had been previously published in the traditional manner and three existed only as mylar-based draft maps. All of the maps were scanned and digitized. For five of the published maps, one or more original field maps were available. It was observed that many field maps had more structural measurements data than appeared on the final, published maps. Consequently, in an effort to increase data density, data were digitized from the original field maps when available.
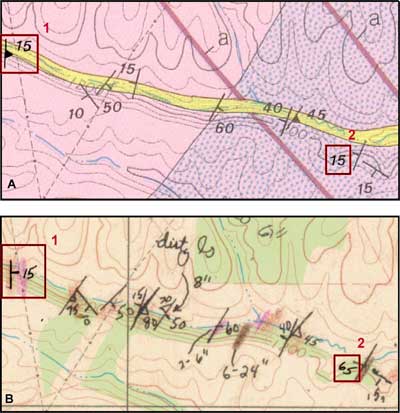
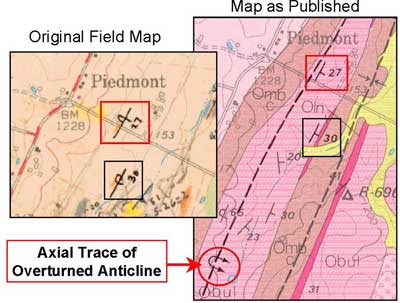
During the process of digitizing point data from field maps, differences were noted between the published and original field maps for the same geographic location or field station data point. These ranged from different dip numbers to different symbols. For example, the published paper map might show a bedding measurement where the field map shows a cleavage measurement (Figure 2) or the field map shows an overturned bedding symbol where the published map shows a normal bedding symbol (Figure 3). Because an error in transcribing a symbol can affect the structural interpretation of the geology (Figure 3), we wanted to quantify the error rate of data misrepresentation on maps published using the traditional pre-digital map production procedures.
 |
 |
|
Figure 2. Published map (A) and the original field map (B) for the same area illustrating two types of discrepancies found. In example 1, on the left edge of the maps, the symbol changed from bedding measurement on the field map (B) to cleavage measurement on the published map (A). In example 2, on the right edge of the maps, the dip measurement was 65 on the field map (B) and 15 on the published map (A). |
Figure 3. Field map and published map for the same area, illustrating the effect on structural interpretation arising from possible errors in transcribing. Bedding measurements marked as overturned on the field map are shown on the published map as normally oriented. If the points had remained overturned, the axial trace of the overturned anticline would have a different alignment. |
An understanding of the methods of pre-digital map production is necessary in order to understand the sources of possible error. Generally, the field geologist recorded observations and field measurements in his notebook and on a field map. This information then was compiled onto a clean map. If more than one geologist mapped in an area, each geologist had his own field and compilation maps which he would ultimately give to the senior geologist who was charged with compiling the final manuscript map.
The senior geologist determined what data to place on the final map. In order to produce a readable, not overly crowded, printed map, it was common to not use all the field measurement data collected, but instead to place on the map representative data that supported the structural interpretation. For example, multiple data points at nearby sites could be represented by one generalized point on the map. The senior geologist compiled the map on paper and had a draftsman transfer it to a mylar base.
When it had been reviewed and approved for publication, the map was prepared for the printer. A draftsman transferred the line data and structural measurement to mylar overlays. For the point data, the draftsman used pre-printed rub-on symbols and numbers. The mylar topographic base map and mylar overlays were sent to the printer, where scribers traced the line work and area colors onto "scribe coats", which were then used to create printing plates. A separate printing plate was created from the point data overlay. During the printing process, the paper was run through each of the color printing plates and the black point data plate in order to produce the final, printed map. Obviously, alignment of the plates was critical in this operation.
Every time the map data were transferred, there was a chance that the data would be copied incorrectly. Many of these errors were caught during the reviews that occurred at multiple points in the traditional map creation process.
Error has three componentsblunders, random error, and systemic error. Of all the error components that affect digital geologic data sets, blunders have received the least study. Although blunders may commonly be thought of as large errors, they can be of any size or magnitude. Blunders are gross errors or mistakes related to carelessness or some other lapse in the system. Blunders are typically related to human mistakes such as reversing coordinates during data entry. Blunders, like systematic errors, are in theory avoidable. However, blunders are not predicable or regular in occurrence. Consequently, they are hard to detect and correct. Blunders can be revealed by comparison of the same data in different datasets.
The discovery of undescribed blunders undermines end-user confidence not only in the data but also in the agency that publishes or distributes the data (Duncan and Campbell, 2005). As noted by Openshaw (1989) "what many applications . . . need is not precise estimates of error but rather some confidence that error and uncertainty levels are not so high as to render in doubt the validity of the results." To maintain the end user's confidence in the data set, the reliability assessment should seek to identify and characterize blunders and systemic error in the data.
How do blunders occur in geologic mapping? Several possible sources of data error exist. The first is mistakes in data collection due to poor training or inattentiveness in the field. Could the field mapper (data collector) recognize field evidence for overturned bedding or the difference between cleavage and bedding? Proper training and testing prior to being allowed to do field work should be standard. Capturing the "collector" as an attribute for each point allows some discrimination should it be later determined that a collector did indeed have a flawed field technique. The data could then be targeted for re-sampling.
A second source is transcription mistakesthe misreading of numbers and symbols as data are copied from, for example, field sheets to compilation maps prepared in the office. The increasing use of portable devices allowing the collector to digitally record the data in the field should greatly reduce the likelihood of a transcription error by reducing the number of times the data is transferred from one media to another, and by reducing the need to read handwritten numbers and symbols.
A final source of difference between the field map and the final published version may be the editing done by the geologist who is in charge of finalizing the map. Some changes may be the result of reinterpretations by the senior geologist while in the office, or after subsequent field visits where the field notes and conclusions are either not recorded or the records have been misplaced.
The type of mistakes revealed by comparing field maps to published maps were largely human errorblunders. The errors were divided into two categories based on the perceived severity of the mistake to geologic interpretation.
A 'Blunder' was recorded if one or more of the following conditions existed for any given point:
A 'Conflict' was recorded if one or more of the following conditions existed for any given point:
The digitizing of point data from the original field maps occurred after the published/mylar point data had been digitized. Paper copies of scans of the field maps were printed and compared to the final published map. When a specific point on the original field map was correctly represented on the published/mylar map, then that point on the original field map was marked to indicate that it had been correctly represented on the published map.
If a point on the original field map was not on the published map or was represented differently on the published map, then the following details were recorded in tabular format for that particular point:
The latitude and longitude of the field map data point locations were digitized using a DOS based computer program. The locations each field map data point were combined with the attributes above. When all points of a particular original field map were digitized, the field map point data were printed on a base map and visually inspected for accuracy.
Original field maps and notebooks were available for the following five quadrangles: Waynesboro West, Fort Defiance, Crimora, Mount Sidney and Broadway. Fort Defiance and Mount Sidney quadrangles had multiple field maps because a team of geologists mapped these quadrangles.
Table 1 shows the results of analysis of the quantity of conflicts and blunders present. The location blunder rate (number of published data point locations with one or more blunders divided by the total number of published point locations) ranged from 0.46% to 15.99%. The location conflict rate (number of published data point locations with one or more conflicts divided by the total number of published point locations) ranged from 0.46% to 5.81%. In Table 1, locations are counted only once. More than one error could be associated with a single point. A point could have a symbol blunder, a dip blunder, and a strike blunder; therefore a maximum of three blunders could be associated with one point, but the point would only count once in the location blunder rate.
Four of the five quadrangles have points with multiple errors. Examining the blunders more closely, Table 2 shows the total number of each type of blunder by quadrangle. Using the sum of blunders instead of the total number of locations with blunders raises the blunder rate (0.46% to 16.95%).
The most frequent blunder was symbol error followed closely by a difference in the dip number. Looking more closely at the type of symbol error (Table 3), the most common mistake was changing a symbol indicating overturned bedding on the field map to right-side-up bedding symbol on the published map. The converse is the next most prevalent mistake. Changing symbols indicating cleavage measurements on field maps to symbols indicating bedding measurement on the published map is the third most common mistake.
| Quadrangle | BWAY24 | MSID24 | FDEF24 | WYNW24 | CRIM24 | Total |
|---|---|---|---|---|---|---|
| Number of field maps Total Number of published points |
1 field map 216 |
3 field maps 519 |
2 field maps 499 |
1 field map 934 |
5 field maps 407 |
-- 2575 |
| Number of locations with Blunders
Number of locations with Conflicts |
1 1 |
83 25 |
60 29 |
14 9 |
13 6 |
171 70 |
| Location Blunder Rate Location Conflict Rate |
0.46% 0.46% |
15.99% 4.82% |
12.02% 5.81% |
1.50% 0.96% |
3.19% 1.47% |
6.64% 2.72% |
| Total Number of Errors Location Total Error Rate |
2 0.93% |
108 20.81% |
89 17.84% |
23 2.46% |
19 4.67% |
241 9.36% |
| Blunder Types | BWAY24 | MSID24 | FDEF24 | WAYNW24 | CRIM24 | Total Blunders | Number of Blunders/ Total pub pt |
|---|---|---|---|---|---|---|---|
| Number of Symbol Blunders Number of Dip Blunders Number of Strike Blunders |
0 1 0 |
51 33 4 |
36 26 4 |
6 9 2 |
5 8 3 |
98 77 13 |
3.80% 2.99% 0.50% |
| Sum of all blunders Published points |
1 216 |
88 519 |
66 499 |
17 934 |
16 407 |
188 2575 |
-- -- |
| Blunder rate | 0.46% | 16.95% | 13.22% | 1.82% | 3.93% | 7.30% | -- |
| Field symbol | Published symbol | Number of points |
|---|---|---|
overturned bedding strike and dip bedding strike and dip bedding strike and dip - top known cleavage strike and dip bedding strike and dip |
bedding strike and dip overturned bedding strike and dip bedding strike and dip bedding strike and dip cleavage strike and dip |
31 19 6 8 3 |
Past studies of error in digital geological databases have been largely concerned with the nature and magnitude of location error. The data presented in this study indicates that the occurrence of blunders, particularly symbol substitution, during the map creation process have been a source of error in geologic maps produced using the traditional method.
A debate arose during the course of this studywhen is an overturned bed fact, and when is it interpretation? Field determination of overturning is based on primary, field observable evidence such as graded bedding or cross-bedding. Properly done, such a determination is factual. In the office, the map compiler may determine that a fold limb is entirely overturned based on structural analysis. This determination is an interpretation. It is important to differentiate between field-observed overturned bedding and an interpretation of overturning that is based on analysis in the office. In this study, an overturned symbol on a field map was considered to be the correct symbol if the printed map showed a normal bedding symbol at that location and the symbol in the final data set was consequently changed. Such a change can have a profound effect on the structural interpretation (Figure 3).
Because field maps could be located for only a few quadrangles, this is not a rigorous regional investigation. However, it does bring to light some interesting aspects of data collection and map creation. Because each map has its own unique history, each map has a characteristic error rate. Some maps are more error prone than others. This is an intrinsic characteristic of the data and gives the user valuable information about the overall reliability of data from one map relative to data from another. If there was a discrepancy between two maps, which one should be reexamined? Even when it is not possible to create blunder rates for every quadrangle due to the lack of a comparison dataset, characterizing the error of a sample of quadrangles gives some measure of the reliability of the overall dataset.
Blunders occur in almost all datasets, whether or not they are recognized. The tendency is to not document the number of blunders found during editing. Yet the blunder rate is a characteristic of the dataset - a function of variables such as authorship and methodology. Characterizing the blunder rate of a dataset gives the user a better understanding of the limitations of that dataset.
Duncan, I., and Campbell, E., 2005, Reliability in Geoinformatics: Theory and Practical Applications in Digital Geologic Map Compilations; Geological Society of America Abstracts with Programs, Vol. 37, No. 7.
Openshaw, S., 1989, Learning to live with errors in spatial databases in: Goodchild, M.F., and Gopal, S., ed., Accuracy in Spatial Databases: Taylor and Francis, Bristol PA, p. 263-276.

![]() U.S. Department of the Interior |
U.S. Geological Survey
U.S. Department of the Interior |
U.S. Geological Survey
URL: pubsdata.usgs.gov /pubs/of/2005/1428/campbell/index.html
Page Contact Information: David R. Soller
Page Last Modified: Saturday, 12-Jan-2013 22:05:44 EST
