U.S. Geological Survey Open-File Report 2005-1428
Digital Mapping Techniques '05—Workshop Proceedings
While geologic maps are now almost always created within a geographic information system (GIS), geologic cross sections still are commonly portrayed and archived as simple un-attributed graphics in either paper form or digital files. Yet, there are several advantages to creating cross sections within the same GIS as the map. Features can be richly attributed and symbolized with the same symbology as in the map, the scale of the cross section can be more closely controlled than in a graphics program, and, once created, it is possible to project the cross section back into the coordinate system of the map with elevation values so that it could be used for 3D analysis or viewing. Furthermore, with the introduction of the Environmental Systems Research Institute (ESRI) geodatabase format, it is possible to store the map and the cross section within the same data container, which simplifies distribution and archiving.
In this paper, I describe a Visual Basic extension to ESRIs ArcGIS program that takes relevant information from a geologic mapthe digital elevation model (DEM), geologic polygon layer, structural point measurements, and borehole information (Figure 1)and builds a template from which the user can begin to digitize a geologic cross section. A surface profile is interpolated from the DEM, apparent dip is calculated for structural measurements, boreholes are shown as stick columns, and the amount of vertical exaggeration can be controlled. The output data are stored within either ESRI shapefiles or ESRI geodatabase feature classes, depending on the format of the input layers.
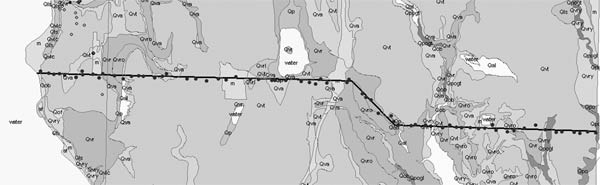
Figure 1. Cross section line in map view, above a geology polygon layer with boreholes.
A key concept employed within this extension is that of linear referencing, a concept likely to be unfamiliar to most GIS users who have a geology backgrounde, as it was primarily designed to manage transportation systems. There are two intrinsic components to linear referencing. The first is a route, that is, a line feature that has been measured so that every vertex stores not only the X and Y attributes of its position but also a value, M, related to its distance from the starting point of the line. The second component is a table of point or line events that occur along that route. In a transportation-based GIS, a table of point events might represent the locations of bus stops along a bus route, and a table of line events might represent sections of a road network that are under construction. When the table of events is referenced to the route, a new feature class is created without requiring the user to know or calculate the XY coordinates of the new features.
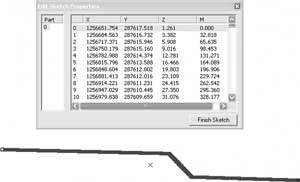
Linear referencing is used in the cross section extension, in three ways. First, the line of cross section on the map is assigned elevation values based on the underlying DEM and then converted into a route so that every vertex stores an X, Y, Z, and M attribute (Figure 2). Next, the extension builds a new line by setting the X value equal to the M and setting the Y value equal to the Z at every vertex (Figure 3). This step flips the cross section line on to its side so that it is represented in the vertical plane. The resulting surface profile is drawn so that the X coordinate at the starting point equals 0 and the X coordinate at the ending point equals the length of the line in the units of the map view. It is also a route retaining the M values from the previous step against which events can be referenced.
 |
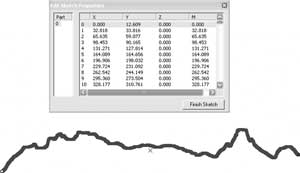 |
Figure 2. The cross section line after Z values have been interpolated from the DEM and after its conversion to a route. Note the first, or starting, vertex has been selected. |
Figure 3. The new surface profile route (with 10 times vertical exaggeration) made by setting X equal to M, Y equal to Z (x10), and keeping the M value from the step before. |
In this second step, linear referencing is used to build tables of line and point events that occur along the cross section route in map view. Line events represent the locations of the intersection between the line of cross section and the boundaries of polygons in an underlying polygon layer, which the geologist interprets as geologic contacts. Point events represent the nearest projected locations of points, either locations of structural measurements or boreholes, along the cross section route within a specified buffer distance. The resulting line events table carries all of the fields from the original polygon layer with the addition of three: a route key field, a from-M field, and a to-M field (Figure 4). The route key field carries a value equal to the user-chosen name of the cross section route so that the linear referencing engine can place the events along the correct route. The from-M and to-M fields carry values that specify the beginning and ending distances along the route of each event. Once the table has been generated from the map view, it is referenced to the surface profile route (Figure 3) in the cross section. The resulting feature class consists of a collection of contiguous lines, each of which represents the intersection of a geologic unit with the topographic surface (Figure 5). Lines can be symbolized by attribute, or with a short perpendicular tick at the end (or beginning) of each line to mark the unit contacts. Point events tables, similarly, retain all of the fields from the original layers as well as an additional route key and M field. Structural measurements are also run through a routine that converts the true dip into an apparent dip.
Figure 4. A portion of the line events table, which is made by locating the geologic unit polygons along the cross section route.
Figure 5. The resulting feature class of lines representing the contacts between the geologic unit polygons.
The final use of linear referencing is to build and attribute borehole stick columns in the cross section view. This process begins with building a line for every borehole, based on the elevation of the borehole collar and the final depth of the hole. Each line representing a borehole is then measured and turned into a route where some unique value, either a numerical id or text name field, is stored as the route key. At this point, a non-spatial table of borehole intervals or layers is required. This type of table is often already part of a borehole database; existing in a one-to-many relationship with another table or feature dataset of borehole locations. The intervals table is used in the same way that the extension-generated events tables (Figure 4) are used. It must contain a route key field of unique values (usually a borehole id or name field) and two fields that describe the top and bottom depth of each interval. Once the intervals events table is referenced against the borehole routes, each borehole column consists of a collection of contiguous lines representing the intervals. The intervals can be symbolized and labeled according to any attribute in the table, to aid in interpretation of the subsurface geology.
The Geologic Cross Section Tool extension is available from me (see email address in title) as a dynamic link library (DLL) file. It has been compiled for ArcGIS 9. Once the DLL has been registered with the host computer, the tool can be added to any ArcMap toolbar through the Customize interface. It appears as a button with a simple faulted strata icon.
To use the tool, first add appropriate layers to an ArcMap data frame. These are: a polygon layer of geology units, a line layer containing one or more lines of cross section, a digital elevation model or similar raster with elevation values, an optional layer showing structural measurement points, an optional layer showing borehole locations, and a related table of borehole intervals.
The following are some requirements for the formats of the layers:
Once the map and tables are ready, the user selects a line of cross section (the selection does not have to occur within an editing session) and clicks on the tool button. A two-page form is displayed, on which the user selects the appropriate values from a series of picklists or enters information (Figure 6). The user must supply a text string, which will be used as the prefix to the feature class names that will be created. Lastly, the user can choose to have the new feature classes added to a new data frame in the map document. The new feature classes are created in the same format and placed in the same workspace (a geodatabase for geodatabase feature classes or a directory for shapefile feature classes) as the layers on which they are based.
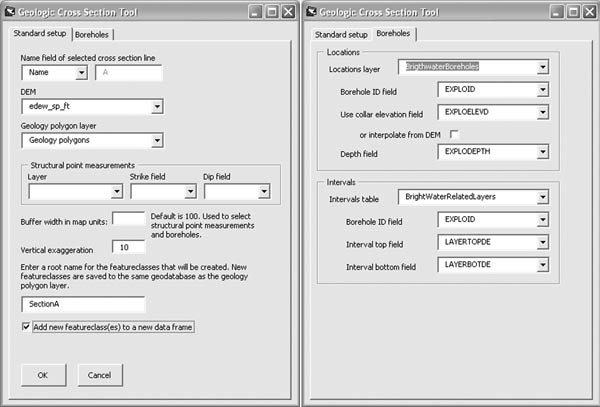
Figure 6. Pages 1 and 2 of the Geologic Cross Section Tool form.
Here are suggestions for managing and editing the cross section layers in the cross section view:
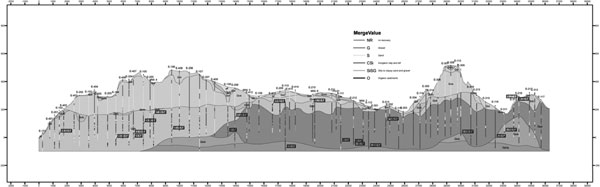
Figure 7. Nearly final version of interpreted geologic cross section showing subsurface geology and boreholes (10x VE). Borehole intervals have been symbolized by classes defined by groups of unified soil classification system codes.
I wrote this extension with two primary goals in mind. First, I wanted to be able to build geologic cross sections in ArcGIS using borehole data without having to purchase an expensive plug-in or a separate software package. In this respect, I have mostly succeeded (Figure 7). The greatest inflexibility is that data in the output layers are not dynamically linked to the input layers or selections, that is, many output files are often generated before an acceptable set is decided upon. As a result, the user must exercise good file management. But the primary advantages are that the symbology of the layers in the map view can be used for the cross section layers and, at least if the geodatabase format is being used, the cross section layers can accompany the map view layers in the same data container.
My second goal was to devise a method for taking interpreted cross section data from the cross section view and converting them into 3D features that would be viewable in a 3D viewing program, such as ArcScene or Earthvision. The extension does not yet do this, but I describe the presumed method here in the event that another developer will wish to implement it. Again, linear referencing will be the key. The process would be to take the X coordinate of every vertex or point in the cross section view and treat that value as an M value which can be referenced to the cross section route in the map view. The X and Y at that measure of M could then be used to create a new vertex or point where the Z value is equal to the Y coordinate from the cross section view. At that point, the process will have come full circle and the new features will have been elevated from simple graphics to attributed spatial features that can be viewed and analyzed alongside other subsurface data.

![]() U.S. Department of the Interior |
U.S. Geological Survey
U.S. Department of the Interior |
U.S. Geological Survey
URL: pubsdata.usgs.gov /pubs/of/2005/1428/thoms/index.html
Page Contact Information: David R. Soller
Page Last Modified: Saturday, 12-Jan-2013 22:05:24 EST
