
|
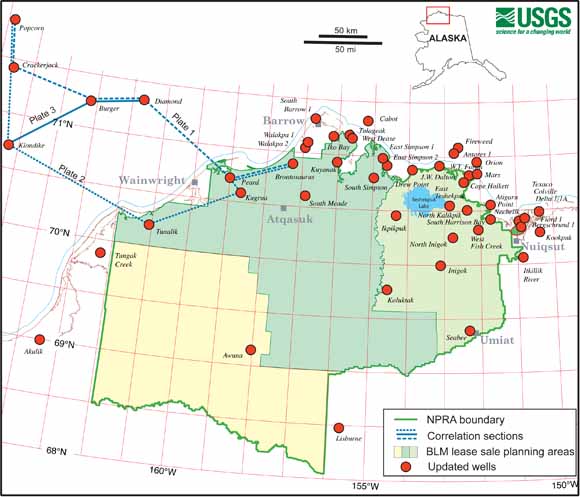
Location of wells with updated paleontology and well-correlation sections. (from figure 1) |
|
This report provides micropaleontologic data (foraminifera, pollen, spores, and microplankton) and interpretations of the rocks penetrated by 49 wells and 3,134 seismic shot holes distributed among 73 seismic lines (figs. 1, 2; table 1). All shot holes and 30 wells are located within the National Petroleum Reserve in Alaska (NPRA); the remaining 19 wells are located adjacent to the NPRA. The biostratigraphic zonation scheme, stratigraphy, and geologic ages followed in this study are summarized in figure 3. This update brings paleontologic analyses performed at various times over several decades to a current, unified set of interpretations that benefit from the evolution of northern Alaska biostratigraphic understanding developed during the past 33-years by Mickey and Haga. For each well, paleontologic information includes microfossil distribution charts, data spreadsheets, diversity graphs, and interpretive reports describing age and environments of deposition. Three biostratigraphic well-correlation sections that relate Chukchi Sea wells to onshore northwestern NPRA wells are also included. For all analyzed seismic shot hole samples, foraminiferal age and environmental interpretations are provided; palynological interpretations are provided only for those shot hole samples collected and analyzed after 1976, a little fewer than half of the total number of samples. |
Download this report as an 11-page PDF file (of2006-1055.pdf; 1.4 MB)
Download Plate 1, Correlation section B-1 of selected wells in the Chukchi Sea and NPRA, as a 61" x 36" PDF file (of2006-1055_plate1.pdf; 1.3 MB)
Download Plate 2, Correlation section B-2 of selected wells in the Chukchi Sea and NPRA, as a 70" x 36" PDF file (of2006-1055_plate2.pdf; 1.8 MB)
Download Plate 3, Correlation section B-3 of selected wells in the Chukchi Sea and NPRA, as a 31" x 36" PDF file (of2006-1055_plate3.pdf; 208 KB)
Download Table 3, Micropaleontology of seismic shot hole samples, as an Excel .xls file (of2006-1055_table3.xls; 632 KB)
Go to the Wells Folder. This folder contains 49 .zip files - one for each well. Each .zip file contains at least five files (C-(well name)-F.pdf, C-(well name)-P.pdf, DV-(well name).pdf, R-(well name).PDF, and S-(well name).XLS) (374 MB total that open into 574 MB when uncompressed). The files consist of:
Distribution Charts—Typically for each well there is one palynology distribution chart (P) and one to as many as four foraminiferal distribution charts (F), depending on number of samples analyzed. All are in PDF-format and are identified in the well folder by the label "C-(well name).pdf". These charts show microfossil occurrence and relative abundance by well depth in feet. The foraminiferal charts also include observed occurrences of radiolaria (RADS.), miscellaneous other microfossils, shell fragments, and distinctive rock, mineral, and hydrocarbon occurrences. Also included on the plots are interpreted age, stage, zone and environment of deposition and faunal statistics.
Data Sheets—Data sheets show numerical (mid-point) abundance converted from relative abundance according to the scheme shown in table 2. Data sheets are in Microsoft Excel® format and are identified in the well folder by the label "S-(well name).xls". All of the microfossil and other components recorded on the distribution charts are incorporated here. For selected wells, a brief description of the lithology observed in the processed foraminiferal sample is included.
Diversity Graphs—Using the numerical values reported in the data sheets, graphs were created showing diversity (number of species) and total abundance of foraminifera, spore-pollen, and microplankton, respectively, for each well. These plots, labeled High Resolution Biostratigraphy Plots, Foraminifera/Palynomorphs, are identified in the well folder by the label "DV-(well name).pdf".
Reports—For each well, a narrative report in is included. This report typically provides a brief description of the number of samples analyzed, the processing and reporting procedures, and the results of the analysis. Results are presented in both abbreviated form—just depth and age—and more detailed form consisting of microfossil zone, a listing of distinctive microfossils, the interpreted environment of deposition, and a brief discussion. These reports are identified in the well folder by the label "R-(well name).pdf"
For questions about the content of this report, contact Ken Bird
|
Help |
PDF help |
Publications main page |
Open-File
Reports for 2006 |
This report is available only on the Web