Open-File Report 2006-1121
In cooperation with the Southeastern Wisconsin Regional Planning Commission
Abstract
Introduction
Purpose and Scope
Previous Studies
Description of the Study Areas
Factors Affecting Surface-Water Quality
Methods and Quality Assurance
Site Selection
Data-Collection Equipment
Data-Collection Schedule
Collection of Manual Samples
Collection of Mercury Samples
Analytical Methods
Quality Assurance
Surface-Water Quantity and Quality
Surface-Water Quantity
Surface-Water Quality
Summary and Conclusions
References Cited
Figure 1. Map showing location of monitored watersheds, the Milwaukee Metropolitan Sewerage District (MMSD) Planning Area, and sampling sites, southeastern Wis.
Figure 2. Map showing quaternary surficial deposits in the Southeastern Wisconsin Regional Planning Commission (SEWRPC) study area and the Milwaukee Metropolitan Sewerage District (MMSD) Planning Area.
Figure 3. Map showing land use in the Southeastern Wisconsin Regional Planning Commission (SEWRPC) study area and the Milwaukee Metropolitan Sewerage District Planning Area.
Figure 4. Map showing population density of southeastern Wisconsin including the Southeastern Wisconsin Regional Planning Commission study area, and the Milwaukee Metropolitan Sewerage District Planning Area.
Figure 5. Map showing photo showing a temporary shelter with sampling instrumentation and equipment at New Fane, Wis.
Figure 6. Graph showing daily precipitation recorded at the National Weather Service Milwaukee/Sullivan site, Wis., May 1 through Nov. 15, 2004.
Figure 7. Graph showing hydrographs of discharge with sample-collection dates at six sites in the upper Milwaukee River and Cedar Creek Basins, Wis., from May 1 through November 15, 2004.
Figure 8. Graph showing hydrographs of discharge with sample-collection dates at three sites in the Root River Basin, Wis., from May 1 through November 15, 2004
Figure 9. Graph showing hydrographs of discharge with sample-collection dates at six sites in the upper Milwaukee River and Cedar Creek Basins, Wis., in the post-flood period starting on July 15, 2004
Figure 10. Graph showing hydrographs of discharge with sample-collection dates at three sites in the Root River Basin, Wis., in the post-flood period starting on July 15, 2004
Figure 11. Photo showing extensive flooding occurred in the study area during June of 2004.
Figure 12. Graph showing changes in chloride, suspended solids, and total phosphorus concentrations during storm events, July 29 through August 15, 2004, at the Newburg, Wis. site.
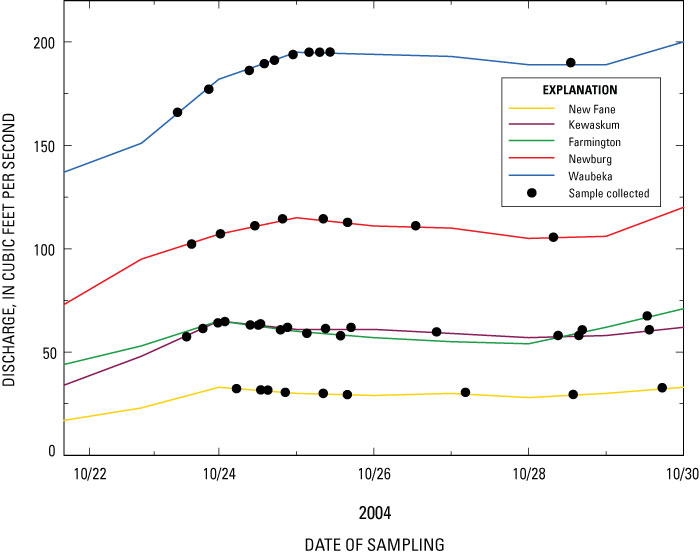
Figure 13. Graph showing discharge data and sample dates at the five upper Milwaukee River Basin sites, southeastern Wis., from October 22 through October 29, 2004.
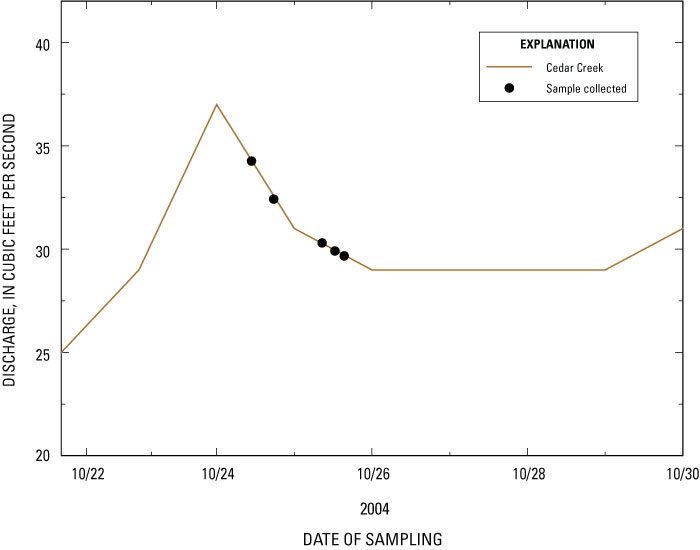
Figure 14. Graph showing discharge data and sample dates at the Cedar Creek site, southeastern Wis., from October 22 through October 29, 2004.
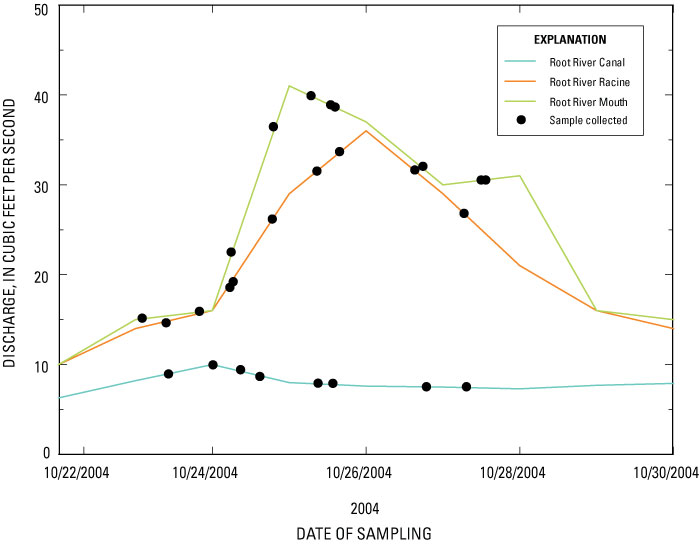
Figure 15. Graph showing discharge data and sample dates at the Root River Canal, Root River Racine, and Root River Mouth sites, southeastern Wis. from October 22 through October 29, 2004.
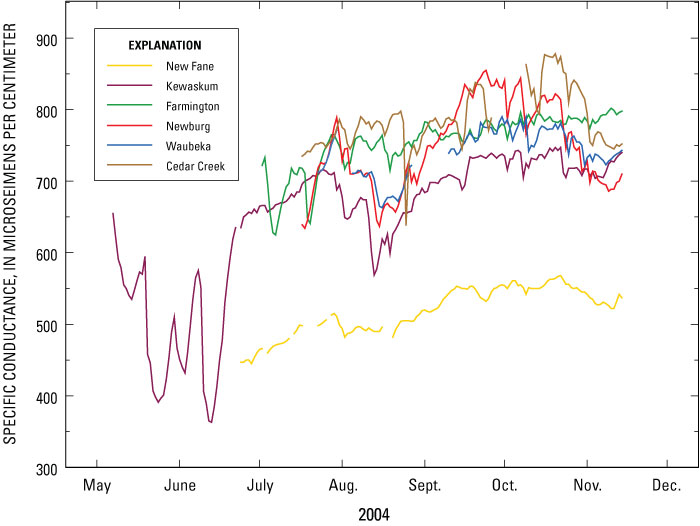
Figure 16. Graph showing daily specific conductance recorded at the six upper Milwaukee River and Cedar Creek Basin sites, southeastern Wis.
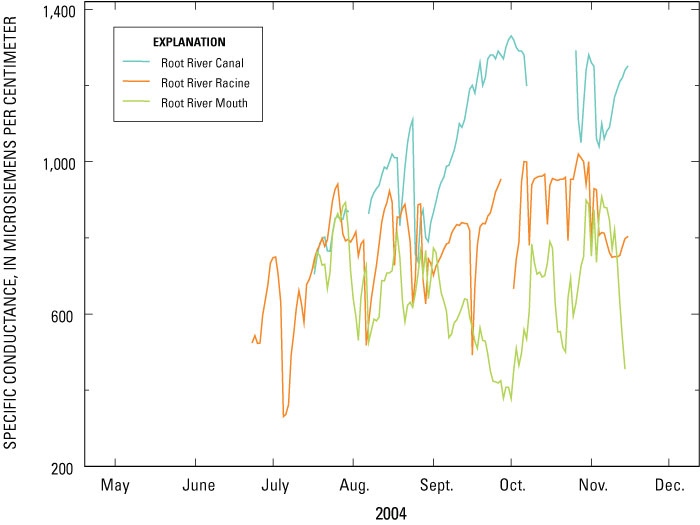
Figure 17. Graph showing daily specific conductance recorded at the three Root River Basin sites, southeastern Wis.
Figure 18. Graph showing daily temperature recorded at the nine sampling sites in southeastern Wis.
Figure 19. Graph showing daily dissolved oxygen concentration recorded at the upper Milwaukee River Basin and Cedar Creek Basin sites, southeastern Wis.
Figure 20. Graph showing daily dissolved oxygen concentration recorded at the three Root River Basin sites, southeastern Wis.
Figure 21. Graph showing statistical distributions of chloride concentrations in samples collected at the nine sampling sites in southeastern Wis.
Figure 22. Graph showing statistical distributions of suspended solids concentrations in samples collected at the nine sampling sites in southeastern Wis.
Figure 23. Graph showing statistical distributions of nitrate plus nitrite-nitrogen concentrations in samples collected at the nine sampling sites in southeastern Wis.
Figure 24. Graph showing statistical distributions of distributions of ammonia-nitrogen concentrations in samples collected at the nine sampling sites in southeastern Wis.
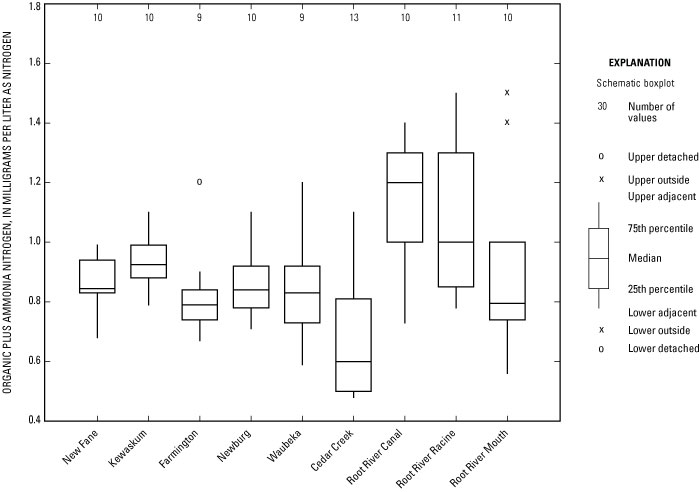
Figure 25. Graph showing statistical distributions of dDistributions of organic plus ammonia Kjeldahl nitrogen concentrations in samples collected at the nine sampling sites in southeastern Wis.
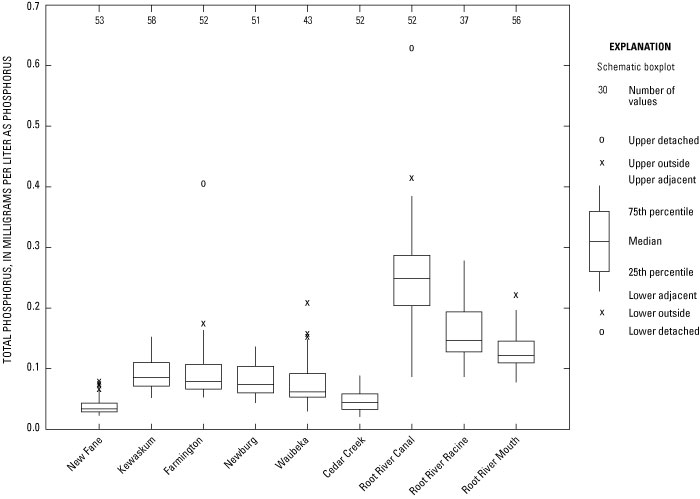
Figure 26. Graph showing statistical distributions of distributions of total phosphorus concentrations in samples collected at the nine sampling sites in southeastern Wis.
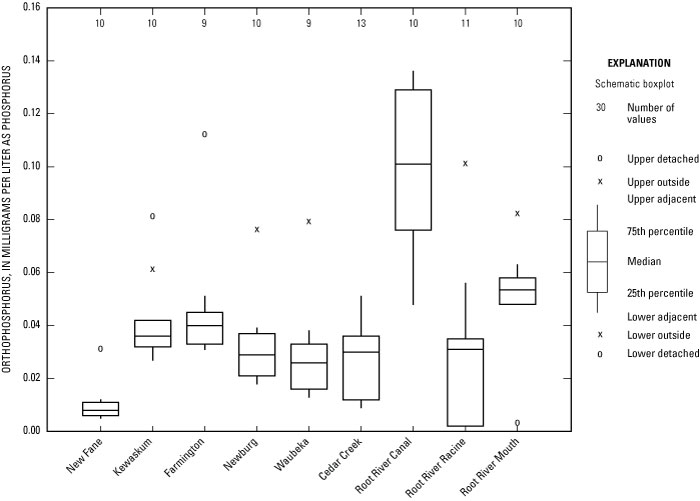
Figure 27. Graph showing statistical distributions of distributions of orthophosphorus concentrations in samples collected at the nine sampling sites in southeastern Wis.
Figure 28. Graph
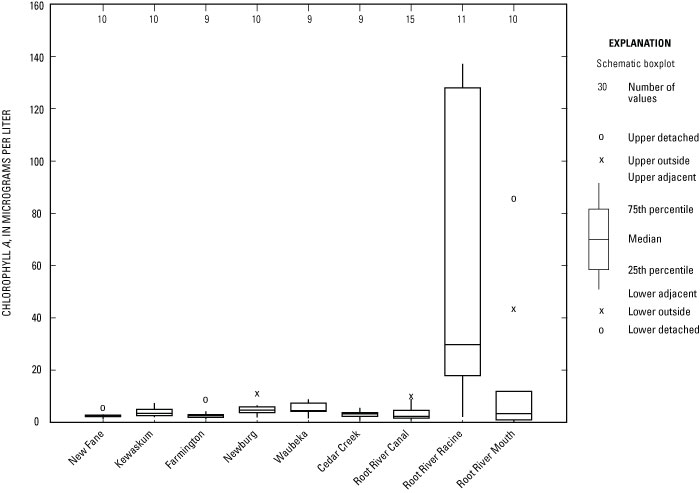
showing statistical distributions of chlorophyll a concentrations in
samples collected at the nine sampling sites in southeastern Wis.
Table 1. Latitude, longitude, and period of historic record for the nine sampling sites in the study area.
Table 2. Land-use inventory for the upper Milwaukee, Cedar Creek, lower Milwaukee, and Root River Basins, southeastern Wisconsin.
Table 3. Number and type of quality-assurance analyses performed at each site in southeastern Wisconsin.
Table 4. Largest historic mean daily discharges, in cubic feet per second, recorded at Cedar Creek, Wis.
Table 5. Largest historic mean daily discharges, in cubic feet per second, recorded at Root River Canal, near Franklin, Wis.
Table 6. Numbers and types of water-quality samples from the nine sites in southeastern Wisconsin.
Table 7. Sampling dates and types of water-quality analysis for sites in the upper Milwaukee River, Cedar Creek and Root River Basins, Wis.
Table 8. Results of water-quality analysis of samples collected during base flow June 30–July 1, 2004, in Wisconsin.
Table 9. Water quality in samples collected during base-flow sampling Sept. 8–9, 2004.
Table 10. Selected water-quality parameters in the upper Milwaukee River Basin, Wis., during base flow on September 9, 2004, and during the storm that began on October 23, 2004.
Table 11. Selected water-quality parameters at Cedar Creek Basin, Wis. during base flow on September 9, 2004, and during a storm event that began on October 23, 2004.
Table 12. Selected water-quality parameters in the Root River Basin, Wis. at base flow on September 9, 2004, and during a storm event that began on October 23, 2004.
Table 13. Biological oxygen demand, fecal coliforms, and Escherichia coli in samples collected at nine sampling sites in Wisconsin.
Table 14. Maximum and minimum concentrations of total copper, particulate mercury, dissolved mercury, particulate methylmercury, dissolved methylmercury, and total zinc for nine sites in Wisconsin.
|
Multiply |
By |
To Obtain |
|
Length |
||
| inch (in.) | 2.54 | centimeter (cm) |
| inch (in.) | 25.4 | millimeter (mm) |
| foot (ft) | 0.3048 | meter (m) |
| mile (mi) | 1.609 | kilometer (km) |
|
Area |
||
| acre | 0.004047 | square kilometer (km2) |
| square mile (mi2) | 2.59 | square kilometer (km2) |
|
Volume |
||
| gallon (gal) | 3.785 | liter (L) |
| gallon (gal) | 0.003785 | cubic meter (m3) |
| cubic foot (ft3) | 0.02832 | cubic meter (m3) |
|
Flow rate |
||
| cubic foot per second (ft3/s) | 0.02832 | cubic meter per second (m3/s) |
|
|
||
Temperature in degrees Celsius (°C) may be converted to degrees Fahrenheit (°F) as follows:
°F=(1.8×°C)+32
Vertical coordinate information for geospatial coverages are referenced to the North American Datum of 1983 (NAD 83) and the North American Vertical Datum of 1988 (NAVD 88).
Altitude, as used in this report, refers to distance above the vertical datum.
Abbreviated water- and suspended solids-quality units: Chemical concentrations and water temperature are given in metric units. Chemical concentrations are given in milligrams per liter (mg/L), micrograms per liter (µg/L), and nanograms per liter (ng/L). Milligrams per liter, micrograms per liter, and nanograms per liter are units expressing the concentration of chemical constituents in solution as weight of solute per volume of water. For concentrations less than 7,000 mg/L, the numerical value of the mg/L concentration is the same as for concentrations in parts per million. The numerical value of concentrations expressed as one microgram per liter is equivalent to one milligram per liter cubed. Concentrations expressed as micrograms per liter are equivalent to parts per billion. Concentrations expressed as nanograms per liter are equivalent to parts per trillion.
Specific conductance is given in microSiemens per centimeter at 25 degrees Celsius (μS/cm at 25°C).
Jude Thomas, Hydrologist, U.S. Geological Survey, Middleton, Wis.
Peter E. Hughes, Supervisory Hydrologist, U.S. Geological Survey, Middleton,
Wis.
David W. Owens, Hydrologist, U.S. Geological Survey, Middleton, Wis.
Kevin D. Richards, Physical Scientist, U.S. Geological Survey, Middleton, Wis.
Dan Olson, Hydrologic Technician, U.S. Geological Survey, Middleton, Wis.
Ryan Jirik, Hydrologic Technician, U.S. Geological Survey, Middleton, Wis.
Thomas Sabin, Hydrologic Technician, U.S. Geological Survey, Middleton, Wis.
Tim Hanson, Hydrologic Technician, U.S. Geological Survey, Middleton, Wis.
Gary Gill, Computer Assistant, U.S. Geological Survey, Middleton, Wis.
Michelle Lutz, Physical Scientist, U.S. Geological Survey, Middleton, Wis.
Ronald Printz, Engineer, Southeastern Wisconsin Regional Planning Commission
Jude Thomas, Hydrologist, U.S. Geological Survey, Middleton, Wis.
Michelle Greenwood, Chief, Publications and Science Support Unit, U.S. Geological
Survey, Middleton, Wis.
Rebecca Woll, Geographer, U.S. Geological Survey, Middleton, Wis.
Jennifer Bruce, Geographer, U.S. Geological Survey, Middleton, Wis.
Dorothy Tepper, Reports Improvement Advisor, U.S. Geological Survey, Reston, Va.
The U.S. Geological Survey, in cooperation with the Southeastern Wisconsin Regional Planning Commission (SEWRPC), collected discharge and water-quality data at nine sites in previously monitored areas of the upper Milwaukee River, Cedar Creek, and Root River Basins, in Wisconsin from May 1 through November 15, 2004. The data were collected for calibration of hydrological models that will be used to simulate how various management strategies will affect the water quality of streams. The data also will support SEWRPC and Milwaukee Metropolitan Sewerage District (MMSD) managers in development of the SEWRPC Regional Water Quality Management Plan and the MMSD 2020 Facilities Plan. These management plans will provide a scientific basis for future management decisions regarding development and maintenance of public and private waste-disposal systems.
In May 2004, parts of the study area received over 13 inches of precipitation (3.06 inches is normal). In June 2004, most of the study area received between 7 and 11 inches of rainfall (3.56 inches is normal). This excessive rainfall caused flooding throughout the study area and resultant high discharges were measured at all nine monitoring sites. For example, the mean daily discharge recorded at the Cedar Creek site on May 27, 2004, was 2,120 cubic feet per second. This discharge ranked ninth of the largest 10 mean daily discharges in the 75-year record, and was the highest discharge recorded since March 30, 1960. Discharge records from continuous monitoring on the Root River Canal near Franklin since October 1, 1963, indicated that the discharge recorded on May 23, 2004, ranked second highest on record, and was the highest discharge recorded since March 4, 1974.
Water-quality samples were taken during two base-flow events and six storm events at each of the nine sites. Analysis of water-quality data indicated that most concentrations of dissolved oxygen, biological oxygen demand, fecal coliform bacteria, chloride, suspended solids, nitrate plus nitrite nitrogen, ammonia nitrogen, Kjeldahl nitrogen, total phosphorus, dissolved orthophosphorus, total copper, particulate mercury, dissolved mercury, particulate methylmercury, dissolved methylmercury, and total zinc were below U.S. Environmental Protection Agency (USEPA) and State of Wisconsin water-quality standards at all sites, with the exception of dissolved oxygen at the Kewaskum, Farmington, Root River Canal, Root River Racine, and Root River Mouth sites. Each of these sites had from several days to several weeks of daily average dissolved oxygen concentrations below the 5 milligrams per liter State of Wisconsin standard for aquatic life. The lowest dissolved oxygen concentrations were measured at the heavily urbanized Root River Mouth site in downtown Racine, Wisconsin, where elevated concentrations of ammonia may have contributed to oxygen consumption during oxidation of ammonia to nitrate. Additionally, the maximum concentrations of copper in several Root River samples exceeded draft USEPA Ambient Water-Quality Criteria (U.S. Environmental Protection Agency, 2003) for acute toxicity to several species of aquatic organisms.
Substantial water-quality changes were not correlated with hydrologic changes at any of the nine sites. Base-flow water-quality was generally indistinguishable from that sampled during storm events. The sparsely developed upper Milwaukee River and Cedar Creek Basins had relatively low ranges of contamination for all laboratory-reported parameters. For all nine sites, the highest reported concentrations of chloride (216 mg/L), total phosphorus (0.627 mg/L), ortho-phosphorus (0.136 mg/L), nitrate plus nitrate (9.32 mg/L), and copper (38 µg/L) were reported for samples collected at the Root River Canal site. The highest concentrations of fecal coliforms (3,600 colonies per 100 mL) and Escherichia coli (2,300 colonies per 100 mL) were reported in samples collected at Kewaskum. The highest concentrations of suspended solids (162 mg/L) and chlorophyll a (137 µg/L) were in samples collected at the Root River Racine site.
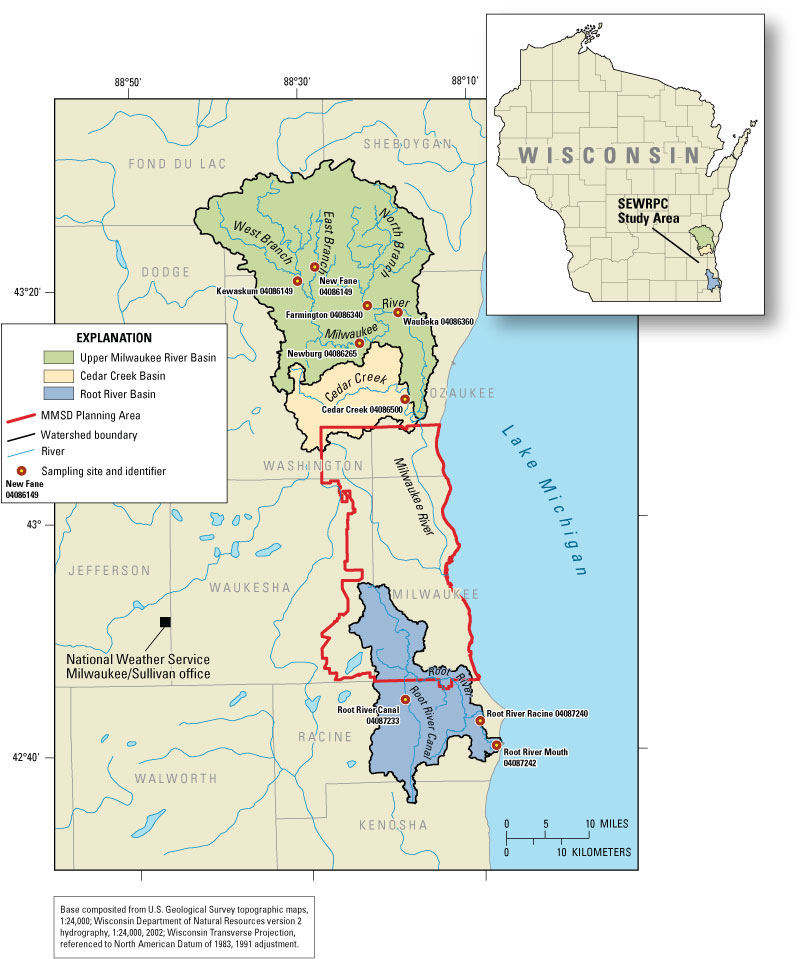
The Southeastern Wisconsin Regional Planning Commission (SEWRPC) and the Milwaukee Metropolitan Sewerage District (MMSD) are responsible for managing the water quality of streams and rivers within the MMSD Planning Area (fig. 1). The SEWRPC Regional Water Quality Management Plan and the MMSD 2020 Facilities Plan are currently (2005) being developed by water-resources managers to present strategies for control of point- and nonpoint-pollution sources, and to provide a scientific basis for managers to make future decisions regarding development and maintenance of public and private waste-disposal systems. Hydrologic Simulation Program Fortran (HSPF) models are being used to assist the planning efforts by providing simulations of future water quality in response to various management and land-use scenarios.
A comprehensive database containing historic and recent water-quality data collected within the MMSD Planning Area was previously constructed (Schneider and others, 2004) to provide calibration and validation data for the HSPF model through a cooperative effort of the MMSD, U.S. Geological Survey (USGS), and the Wisconsin Department of Natural Resources (WDNR). The database contains water-quality data for the MMSD Planning area but is lacking water-quality data in areas to the north and south of the Planning Area. Data from these areas are needed to provide accurate source terms for the boundaries of the HSPF models.
An important part of the mission of the USGS is to collect, evaluate, and disseminate water resources information for the protection of human and aquatic health, and to ensure the enhancement of environmental quality for future generations. The USGS Water Resources Discipline (WRD) conducts assessments of water quality and quantity at a variety of scales. Hydrologic information is disseminated to the public in reports, presentations, and the World Wide Web. Results of USGS investigations are frequently used by other government agencies (federal, state, local, tribal) to understand and manage their water resources.
SEWRPC will use the data generated by this project to determine how various management strategies will affect water quality in the Milwaukee and Root River drainage basins in southeastern Wisconsin. Data collected as part of this project may be also used by other local, regional and state agencies to evaluate existing hydrologic and water-quality conditions in southeastern Wisconsin.
Additionally, the USGS is uniquely positioned to provide a leadership role in aquatic mercury investigations such as those being conducted as part of this SEWRPC project. The USGS was a prominent participant in the series of studies conducted in northern Wisconsin that largely form the basis of current knowledge about mercury in aquatic ecosystems. The ongoing National Water-Quality Assessment (NAWQA) program in the Lake Michigan drainages of Wisconsin provides additional infrastructure and expertise to gain a local perspective on mercury contamination. A recently established mercury research laboratory in Madison, Wisconsin gives USGS scientists the necessary analytical capabilities to conduct state-of-the-art contamination studies. Thus, the USGS is well situated to advance the understanding of mercury cycling in aquatic ecosystems and to assist resource-management agencies in developing strategies for reducing the effects of mercury contamination.
This report presents discharge and water-quality data that were collected in southeastern Wisconsin from May 1 through November 15, 2004, by the USGS in cooperation with SEWRPC to facilitate development of the HSPF model. The data provide calibration datasets for areas outside of the MMSD Planning Area boundaries (fig. 1), including the upper Milwaukee River, Cedar Creek, and Root River Basins.
Figure 1. Location of monitored watersheds, the Milwaukee Metropolitan Sewerage District (MMSD) Planning Area, and sampling sites, southeastern Wis.
The upper Milwaukee River and Root River Basins have been researched in recent decades by the MMSD, SEWRPC, Wisconsin Department of Natural Resources, the University of Wisconsin Cooperative Extension Service, the USGS, and many others. Specific reports of interest for the upper Milwaukee River and Root River Basins include Burzynski, Beaumier, Benninghoff, and others (2001), and Burzynski, Helker, Cooper and others (2002). A comprehensive list of relevant publications describing the soils, geography, environmental quality, and land use and planning was recently published in Schneider and others (2004).
Many environmental resources, including fisheries in the upper Milwaukee River, Cedar Creek, and Root River Basins, have been well researched. However, a recent and representative data set describing ambient hydrologic and water-quality conditions in the upper Milwaukee River and lower Root River basins outside the boundary of the MMSD Planning Area did not exist prior to the current study.
The study areas included the North Branch, East Branch, and West Branch Basins of the upper Milwaukee River to the north of the MMSD Planning Area, and Cedar Creek and Root River Basins to the south (fig. 1). Nine water-quality monitoring sites (fig. 1; table 1) were established to provide representative discharge and water-quality data for calibration of the SEWRPC and MMSD Planning Area HSPF models.
Table 1. Latitude, longitude, and period of historic record for the nine sampling sites in the study area.
[USGS, U.S. Geological Survey; ddmmss, degrees, minutes, seconds; ° , degrees; ', minutes; ", seconds; --, no data available; location of sites shown in figure 1]
(USGS site number) |
and location |
(dd°mm°ss°) |
(dd°mm'ss°) |
|
East Branch Milwaukee River at New Fane, Wisconsin
|
1968–1981
|
|||
Milwaukee River Upstream of Kewaskum Dam, Wisconsin
|
--
|
|||
North Branch Milwaukee River at Farmington, Wisconsin
|
1968–1981
|
|||
Milwaukee River at Highway M near Newburg, Wisconsin
|
--
|
|||
Milwaukee River at Waubeka, Wisconsin
|
1968–1981, 1994
|
|||
Cedar Creek at Cedarburg, Wisconsin
|
1930–1970, 1973–1981, 1983–1987,1990–present
|
|||
Root River Canal near Franklin, Wisconsin
|
1963–present
|
|||
Root River at Racine, Wisconsin
|
1963–present
|
|||
Root River near the Mouth, Racine, Wisconsin
|
--
|
Six of the nine sites were in the upper Milwaukee River and Cedar Creek Basins to the north of the MMSD Planning Area. The upper Milwaukee River Basin SEWRPC project sites were on or near the North, East, and West Branches in the upper Milwaukee River Basin as well as on the main stem of the Milwaukee River (fig. 1). The Kewaskum site (fig. 1; table 1) was in the headwaters of the Milwaukee River downstream of the West Branch confluence with the Milwaukee River. The New Fane site was also in the headwaters of the Milwaukee River Basin but was on the East Branch. The East Branch forms a confluence with the Milwaukee River in the Kettle Moraine State Forest south of the city of Kewaskum and south of the Kewaskum sampling site. The Milwaukee River then flows southward through the city of West Bend before turning east towards the Village of Newburg and the former Newburg site. Downstream of Newburg, the Milwaukee River forms a confluence with the North Branch (downstream of the Farmington North Branch site). The river then flows to the unincorporated community of Waubeka and the former Waubeka site.
No sampling sites were upstream of the Kewaskum (on Milwaukee near the West Branch), New Fane (East Branch), and Farmington (North Branch) sampling sites; however, Kewaskum and New Fane were upstream of the Newburg site. The Newburg and Farmington sites were upstream of the Waubeka site. Cedar Creek forms a confluence with the Milwaukee River downstream of the former Waubeka site. The Cedar Creek site was upstream of the confluence and, therefore, only provided data representative of water-quality in the Cedar Creek Basin.
The remaining three SEWRPC sampling sites were within the Root River Basin, to the south of the MMSD Planning Area (fig. 1). The Root River main stem headwaters area is in the heavily urbanized southernmost parts of the MMSD Planning Area near the city of West Allis; however, the Root River flows to the southeast out of the MMSD Planning Area toward the city of Racine and ultimately to Lake Michigan. Most of the Root River Basin is south of the MMSD Planning Area.
The water quality of the Root River Canal tributary is more affected by agricultural sources of contamination than the intensively urbanized Root River main-stem headwaters areas within the densely populated MMSD Planning Area. The confluence of the urban Root River headwaters with the more rural Root River Canal tributary is upstream of the former Root River Racine and Root River Mouth sites (fig. 1).
There are no large tributaries entering the Root River downstream of the Root River Racine site that would affect water quality of the downstream Root River Mouth site. Water quality at the Root River Mouth site, however, could have been affected by urban and marina discharges in the downtown area of the city of Racine and by intermittent mixing with Lake Michigan. Streamflow reversals caused by wind- or seiche-induced variations in lake stage frequently cause Lake Michigan to flow upstream into the Root River channel near the Root River Mouth site.
Water quality in the upper Milwaukee River, Cedar Creek, and Root River Basins is affected by the geologic setting, land uses, and population density of each basin. The following sections provide a brief description of each factor.
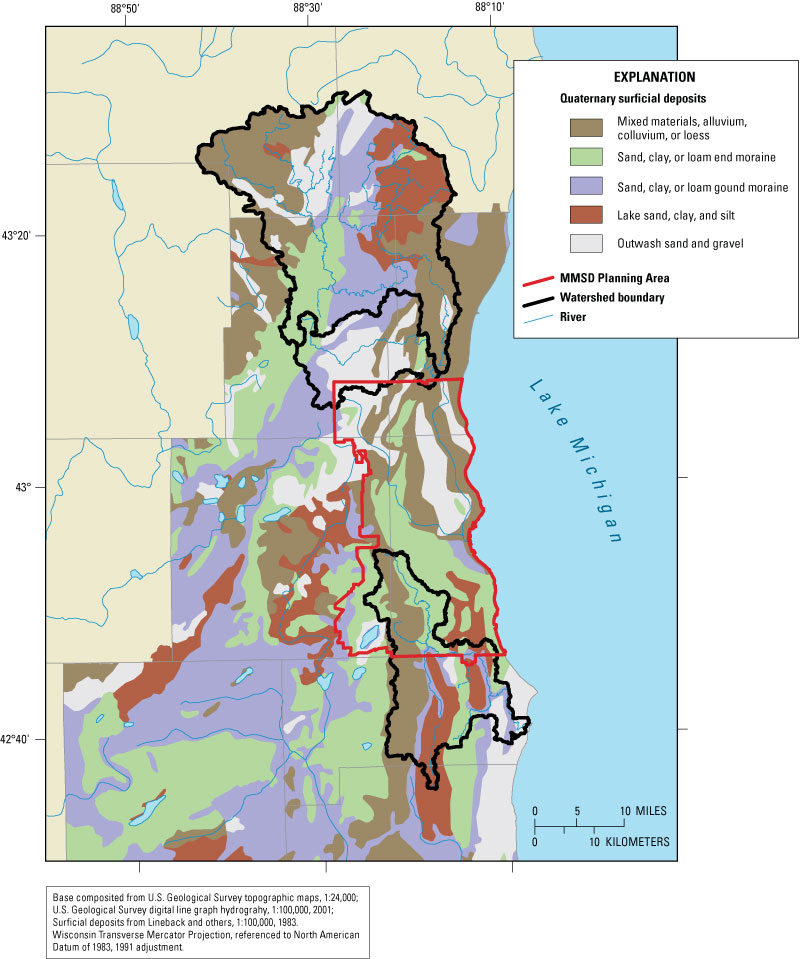
The surficial deposits of southeastern Wisconsin are primarily sands, silts, clays, and regolith, with some irregularly distributed carbonaceous materials, that have been highly altered by glaciation (fig. 2). Common glacial features include lateral and end moraines, outwash plains, and drumlins that are interspersed with riverine, lake, regolith, and aeolian deposits (Martin, 1965).
Figure 2. Quaternary surficial deposits in the Southeastern Wisconsin Regional Planning Commission (SEWRPC) study area and the Milwaukee Metropolitan Sewerage District (MMSD) Planning Area.
The surface altitude of the Milwaukee River Basin ranges from 580 ft to 1,360 ft above sea level (Burzynski, Beaumier, Benninghoff, and others, 2001). The land area of the entire Milwaukee River Basin is approximately 700 mi2. The surface altitude of the Root River Basin ranges from 580 ft to 840 ft above sea level. The land area of the Root River Basin is approximately 197 mi2 and includes 117 miles of streams.
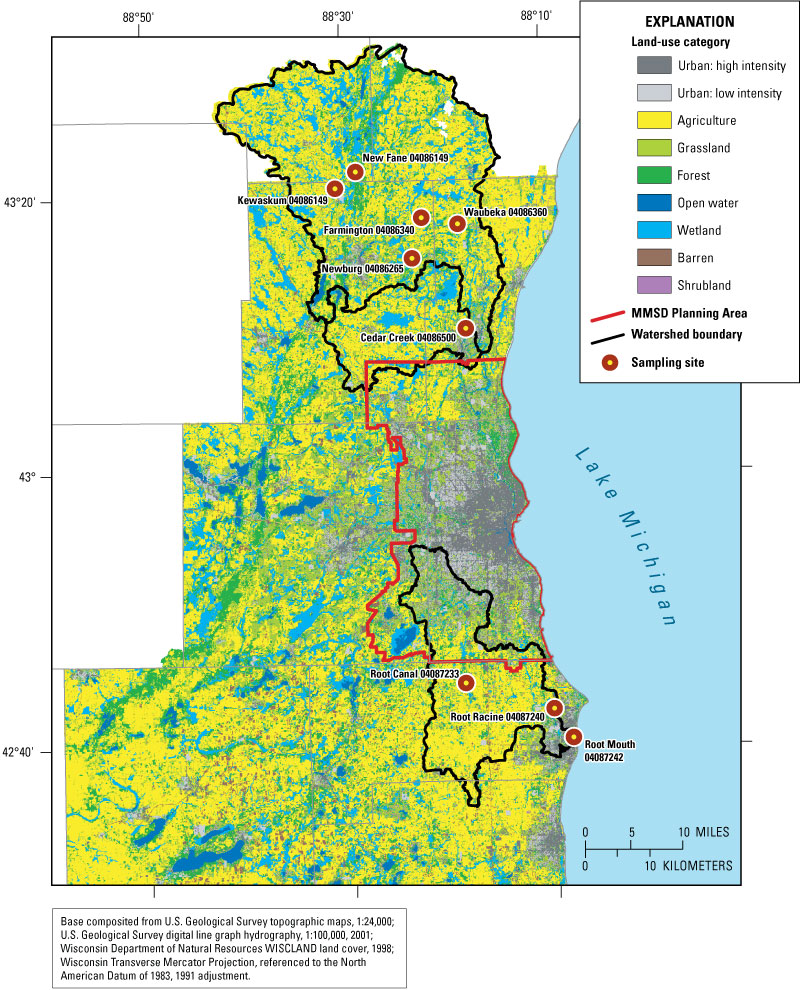
The rural and sparsely developed character of the upper Milwaukee River and Cedar Creek Basins is shown in table 2 and in figure 3. Approximately half of the land area in both basins is agricultural, relative to only 14.6 percent of the area in the lower Milwaukee River Basin in the more intensely urban MMSD Planning Area downstream (fig. 3). The upper Milwaukee and Cedar Creek Basins contain extensive and undeveloped wetlands.
Table 2. Land-use inventory for the upper Milwaukee, Cedar Creek, lower Milwaukee, and Root River Basins, southeastern Wisconsin.
[Land-use types are illustrated on figure 3; all numbers represent percentages of land use]
River Basin (percent) |
Basin (percent) |
River Basin* (percent) |
Basin (percent) |
|
| High urban | ||||
| Low urban | ||||
| Agriculture | ||||
| Grassland | ||||
| Forest | ||||
| Open water | ||||
| Wetland | ||||
| Barren | ||||
| Shrubland |
* No study sites were in the lower Milwaukee River Basin; however, six of the nine study sites were upstream of the lower Milwaukee River Basin.
Figure 3. Land use in the Southeastern Wisconsin Regional Planning Commission (SEWRPC) study area and the Milwaukee Metropolitan Sewerage District Planning Area.
Land use in the Root River Basin (fig. 3) is also approximately half agricultural (49.2 percent)(table 2), with some high (7.6 percent) and low (6.4 percent) urban development, and fewer wetland areas relative to the upper Milwaukee (16.5 percent) and Cedar Creek (16.9 percent) Basins. Most of the agricultural land in the Root River Basin is in the upstream areas around the Root River Canal tributary.
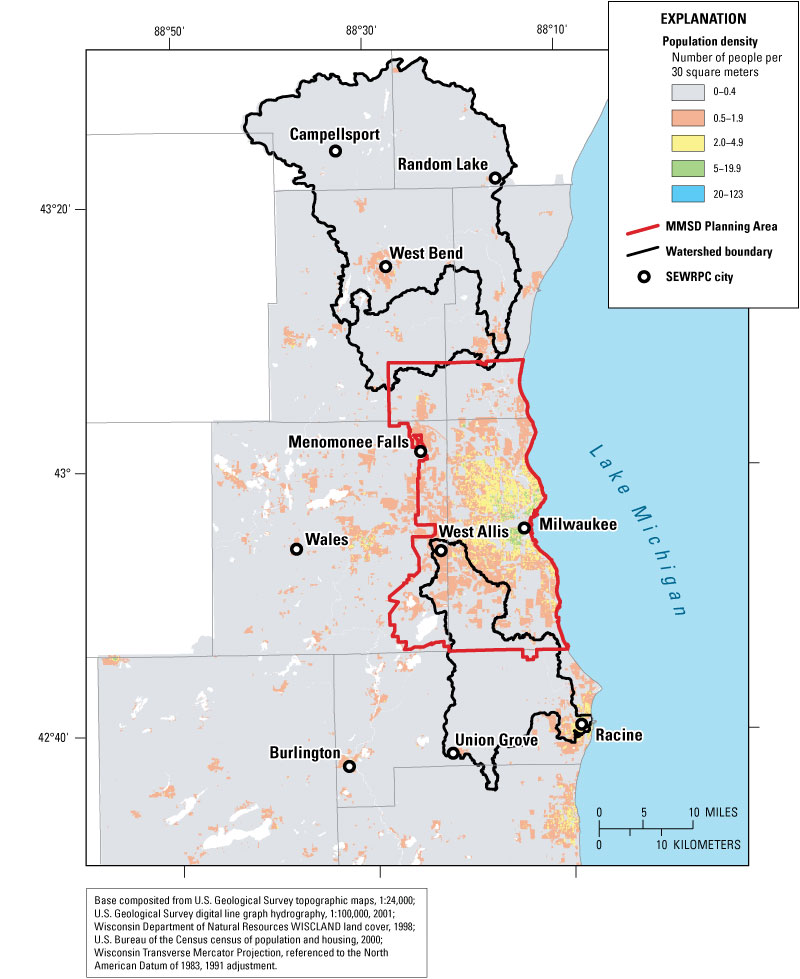
The population density of the rural, upper Milwaukee River and Cedar Creek Basins is low relative to the more urbanized areas in the MMSD Planning Area (fig. 4). According to the 2003 revision of the 2000 Census (U.S. Census Bureau, 2000), Kewaskum had a population of 3,724 and Cedarburg had a population of 5,744—these areas are sparsely inhabited relative to the population of approximately 596,974 people residing in the city of Milwaukee and 940,164 people residing in the greater Milwaukee area that comprises much of the MMSD Planning Area. According to the 2000 Census, Racine, Wis. had a population of 81,855—a greater population density than cities in the upper Milwaukee and Cedar Creek Basins, but less than those in the intensely urban areas in and around downtown Milwaukee.
Figure 4. Population density of southeastern Wisconsin including the Southeastern Wisconsin Regional Planning Commission study area, and the Milwaukee Metropolitan Sewerage District Planning Area.
Data-collection equipment, data-collection schedule, collection of manual samples, collection of mercury samples, analytical methods, and quality assurance are discussed in this section of the report.
The nine project sites (table 1) were near the mouths of major tributaries to, or on the main stem of, the upper Milwaukee River, Cedar Creek, and the Root River to provide samples that were representative of water quality in each basin. Existing USGS gages for discharge monitoring were equipped for water-quality sampling at Cedar Creek at Cedarburg, Wis.; Root River Canal near Franklin, Wis.; and the Root River Racine near Racine, Wis. USGS sites that had been discontinued were re-installed at the East Branch Milwaukee River at New Fane, Wis.; the North Branch Milwaukee River at Farmington, Wis.; and the Milwaukee River at Waubeka, Wis. New sites were installed at Milwaukee River upstream of Kewauskum Dam, Wis.; Milwaukee River at Highway M near Newburg, Wis.; and Root River near the Mouth, Racine, Wis.
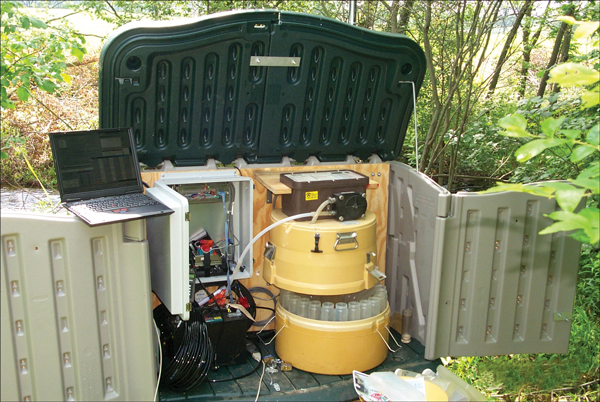
Each site (table 1) was equipped with a Campbell CR-10 data logger; a pressure-sensor system to record stage (transducer or bubbler); a continuous water-quality monitor (Hydrolab) that was routinely calibrated to record continuous dissolved oxygen, temperature, and specific conductance data; and an automated 24-bottle sampler. The equipment at each site was housed in either a temporary plastic shed or in a full-sized permanent aluminum shelter (fig. 5). Each site was further equipped with either a cell phone or internet-enabled modem that was wired to the site data logger so that hydrologic and water-quality data could be remotely retrieved and sample collection could be remotely scheduled or triggered to supplement programmed time or stage-based sampling.
Figure 5. Temporary shelter with sampling instrumentation and equipment at New Fane, Wis. The white box houses a Campbell CR-10 data logger installed near the top, and a modem and telephone resting in the bottom of the box. A 12-volt battery under the box powered the station, and was recharged by a 30-watt solar panel (on pole above the shelter, not shown).
The 24-bottle automatic sampler was triggered by changes in stage and (or) time, or was remotely triggered by telephone. Hydrolab water-quality monitoring probes were used in combination with the Campbell CR-10 data logger to record continuous temperature, specific conductance, and dissolved oxygen data using methods described in Wagner and others (2000).
Six high-flow storm events were sampled. Samples from two of these events were intensively analyzed; these are referred to herein as “intensive analysis events.” Samples from the remaining four runoff events were only analyzed for total suspended solids and total phosphorus; these are referred to herein as “partial analysis events.” Two base-flow samples were also collected at each site and analyzed.
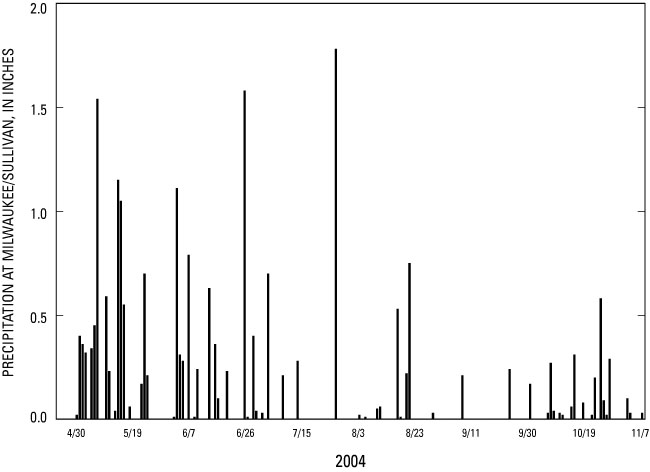
“High-flow storm events” were originally defined as those events when discharges double in magnitude, and flows do not return to preexisting discharge during a 48-hour period. Because of a lack of rainfall during the summer and early fall that followed the May–June 2004 floods, samples were collected during any recognizable discharge hydrograph rise from any basinwide storm in either basin. Additionally, the data-collection period had to be extended to November 15 from the original end date of August 31, 2004, to collect enough samples to complete HSPF model calibration datasets. Typical summer storms that ranged from 0.50 to 0.75 inches of precipitation during the study (fig. 6) did not cause doubling of discharge at most sites in either basin, although increases in stage in response to substantial precipitation did last 48 hours or longer.
Figure 6. Daily precipitation recorded at the National Weather Service Milwaukee/Sullivan site, Wis., May 1 through Nov. 15, 2004. Location of the site shown in figure 1.
Eight samples were collected from the rising limb of the discharge hydrographs, near the peak, and on the recession for each of the six high-flow storms. Samples were collected during different storms in the Milwaukee River Basin sites and the Root River Basin because individual storms did not distribute precipitation equally between basins.
For all sampled parameters that were manually collected, USGS clean sampling and processing protocols established by U.S. Geological Survey (U.S. Geological Survey, variously dated) were followed. Manually collected samples were collected using either the Equal-Width-Interval (EWI) method or the multiple vertical method where the stream velocity was less than 1.5 ft/s. After collection, samples were transported in iced coolers to the USGS Southwest Wisconsin field office in Middleton, Wisconsin, where they were split, filtered, and preserved. Sample holding times for biological oxygen demand (BOD), total coliforms, orthophosphorus, and Escherichia coli required samples to be analyzed within a maximum of 24 to 48 hours after collection. Therefore, these samples were promptly retrieved, prepared, and transported to the Wisconsin State Laboratory of Hygiene (WSLH) as soon as possible after collection.
Escherichia coli and fecal coliform samples deteriorate rapidly after collection and before analysis; therefore, the project protocols called for sample collection, preparation, and delivery to the analytical laboratory within 24 hours after collection. Although laboratory personnel were generally notified prior to sample delivery, additional time was required to login the samples and prepare the analytical tests. Therefore, most of the Escherichia coli and fecal coliform results for this project were flagged to indicate that the samples were analyzed from 24 to 48 hours after sample collection. It is estimated that bacteria die off at a rate of one order of magnitude for each 24-hour period that analysis is delayed after a sample is collected (Sharon Kluender, Wisconsin State Laboratory of Hygiene, oral commun., August 2004). The USEPA Escherichia coli water-quality standard for recreational waters is 235 fecal coliforms per 100 mL of sampled water (Wigal, 2002).
Mercury sampling was developed with guidance from Mark Olson (USGS Wisconsin Mercury Research Laboratory (WMRL), oral commun., 2004). At each of the nine sites, one base-flow and one stormflow event were sampled for mercury, in addition to three quality-assurance samples, for a total of 21 mercury samples. Samples were analyzed for particulate mercury, dissolved mercury, particulate methylmercury, and dissolved methylmercury.
Water-quality samples were collected as a grab sample from the center of the stream using lab-supplied, ultra-clean, disposable, polyethylene terephlalate copolymer (PETE) bottles transported to the field in doubled, sealed, clear plastic bags. Powderless laboratory gloves were worn during sample collection and handling. Mercury samples were processed separately from other chemical constituent samples, and were filtered and processed at the WMRL. Strict filtering and acidification protocols in the WMRL ultra-clean environment using equipment cleaned to parts per trillion (PPT) levels were followed to minimize contamination of samples.
All water-quality samples for this study, with exception of the mercury samples, were analyzed at the Wisconsin State Laboratory of Hygiene (WSLH) in Madison, Wis.. Calcium, magnesium, sodium, potassium, sulfate, chloride, fluoride, silica, biological oxygen demand, fecal coliform bacteria, Escherichia coli, Kjeldahl nitrogen, ammonia nitrogen, nitrate plus nitrite nitrogen, total phosphorus, dissolved orthophosphorus, total copper, total zinc, and chlorophyll-a analyses were analyzed in accordance with internal lab protocols (George Bowman, Wisconsin State Laboratory of Hygiene, written commun., February 2006) and using internal laboratory quality-assurance procedures and protocols for each analysis. Zinc and copper were analyzed by Inductively Coupled Plasma. Mercury concentrations were analyzed at the USGS Wisconsin Science Center Mercury Lab (WMRL) according to procedures published in Olson and DeWild (1999) and DeWild and others (2002).
Quality Assurance (QA) procedures relevant to collected data are described in Garn (2002), including computation of discharge from stage, records, checking, gage height, rating, and errors, datum corrections, gage-height corrections and shifts, station analysis procedures, and records management. General procedures for the collection of water-quality samples in the USGS are documented (K.D. Richards and others, U. S. Geological Survey, written commun., 2006).
Seventy-two, or approximately 14 percent of the 507 samples collected were assessed using quality-assurance protocols (table 3). Some samples used in the QA/QC assessments, such as replicate samples, or the first sample of a pair of duplicates, also served as regular field samples. Blanks included trip blanks, automatic-sampler head and bottle blanks, automatic-sampler head and sample-line blanks, and a cone-splitter blank.
Table 3. Number and type of quality-assurance analyses performed at each site in southeastern Wisconsin.
[Replicates are sequentially collected samples; duplicates are single samples split into two identical subsamples; blanks are clean water samples that were exposed to tubing and (or) sample-bottle surfaces; Manual refers to samples composited from manually collected subsamples across a stream; automated refers to samples collected using an automated sampler; location of sites shown in figure 1]
(fig. 1) |
pairs |
|||
| New Fane | ||||
| Kewaskum | ||||
| Farmington | ||||
| Newburg | ||||
| Waubeka | ||||
| Cedar Creek | ||||
| Root River Canal | ||||
| Root River Racine | ||||
| Root River Mouth |
Results of quality-assurance sample analyses were acceptable, with three exceptions. Traces of contamination were present in a head-and-tubing blank collected at Waubeka on October 12, 2004. Laboratory-grade blank water, certified by the USGS National Water Quality Laboratory as inorganics free, was used in a single rinse of the approximately 20 ft of automatic sampler line and then a sample of the laboratory water was collected through the line and sampler head into a standard plastic sample bottle. This rinse and sample collection protocol is essentially the same procedure used for the high-flow storm sample and base-flow sample collection, with the exception that the laboratory grade water was used. The sample analysis indicated traces of concentrations in the sample blank: chloride (2.1 mg/L), Kjeldahl-N (0.14 mg/L), specific conductance (24 µS/cm), and nitrate plus nitrite nitrogen (0.033 mg/L). Analytical results from this rinse sample were received from the lab after the end of the study; therefore, a further investigation into the cause of the contamination was not possible.
To assess the accuracy of the method of using automatically collected suspended solids samples to sample water-quality at the intake of the sample tube, automatically collected samples were paired with a concurrent, manually collected, suspended solids sample that was integrated across the entire width of the stream using either the equal-width-interval (EWI) or multiple-vertical sampling methods twice at each site. Two of the 18 manual/automatic pairs (table 3) demonstrated substantial disagreement indicating that the single-point, automatically collected sample may not have been representative of suspended-solids concentrations across the width and depth of the entire stream.
One of the two manual/automatic sampling pairs was collected on October 10, 2004, at Waubeka. The automatically collected point sample had a suspended solids concentration of 25 mg/L and the concurrent multiple-vertical sample had a concentration greater than 2 mg/L. The other manual/automatic pair was collected at the Root River Canal site on October 25, 2004, where the automatic point sample had a suspended solids concentration of 29 mg/L and the multiple-vertical sample had a concentration of 8 mg/L. These results indicate that potentially 2 out of 18, or 11 percent for this study of automatically collected point samples might not provide a consistently representative sample of suspended-solid concentrations in a stream. This limitation of point samples is well known because the diverse types and sizes of particles transported in a stream are almost never uniformly distributed in a stream water matrix with respect to width and depth (Guy and Norman, 1970).
Measured and computed discharge at the Root River at the Mouth station was rated poor because of the difficulty of measuring and calibrating the rapidly reversing flow (at times flow reversed every few minutes for several hours) in addition to a complex channel geometry at the site that sometimes caused stratified flow, or variable velocities from side to side as in cyclonic flow. Because some base-flow periods were initially computed as having higher discharges than would seem reasonable given the basin area, flow from the station upstream at the Root River at Racine was multiplied by 1.04 to provide estimates of flow where needed due to suspect data. Therefore, daily discharge data for the Root River at the Mouth are a composite of monitored data for storm periods, and a mix of monitored and estimated data for the base-flow periods.
Surface-water quantity and quality data were collected at the nine sites in the study area from May 1, 2004, through November 15, 2004. All discharge data were published in Waschbusch and others (2005).
Large-scale flooding occurred at all sampling sites during May and June of 2004 (figs. 7 and 8; tables 4 and 5) immediately after all stations were established. The flooding was caused by irregularly distributed and excessive rainfall in southeastern Wisconsin during May and June (fig. 6). In May 2004, 8.18 in. of rain (3.06 in. is normal) was recorded at the Milwaukee-Sullivan station but parts of the basin received over 13 in. of precipitation (National Weather Service, 2004). In June 2004, 4.07 in. of precipitation (3.56 in. is normal) was recorded at the Milwaukee-Sullivan station; however, most of the monitored basins received between 7 and 11 in. of rainfall (National Weather Service, 2004). Rainfall data from the Milwaukee-Sullivan station were selected because this station was in the path of many of the storms that moved through the basins from west to east, or from the southwest toward the northeast.
Table 4. Largest historic mean daily discharges, in cubic feet per second, recorded at Cedar Creek, Wis.
[mm/dd/yyyy, month, day, year; location of the site shown in figure 1. Source of data: U.S. Geological Survey National Water Information System (NWIS) database]
(mm/dd/yyyy) |
(cubic feet per second) |
Table 5. Largest historic mean daily discharges, in cubic feet per second, recorded at Root River Canal, near Franklin, Wis.
[mm/dd/yyyy, month, day, year; location of the site shown in figure 1. Source of data: U.S. Geological Survey National Water Information System (NWIS) database]
(mm/dd/yyyy) |
(cubic feet per second) |
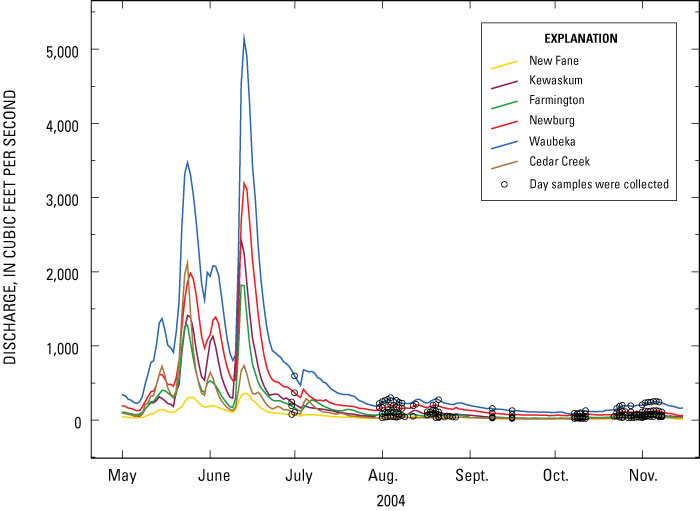
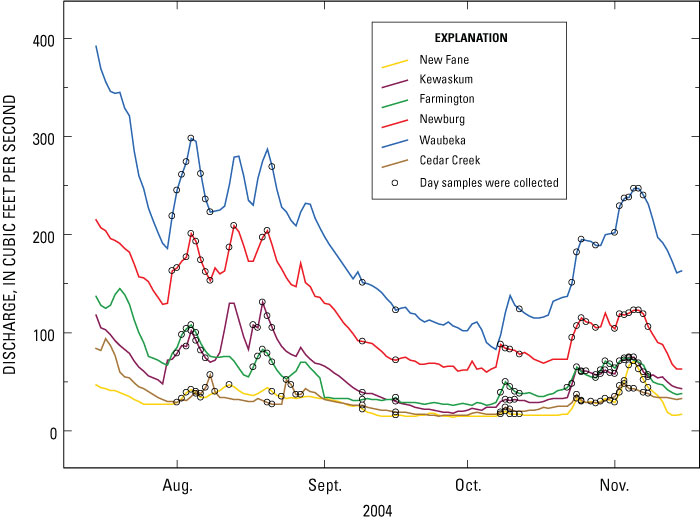
Figure 7. Hydrographs of discharge with sample-collection dates at six sites in the upper Milwaukee River and Cedar Creek Basins, Wis., from May 1 through November 15, 2004. Location of the sites shown in figure 1.
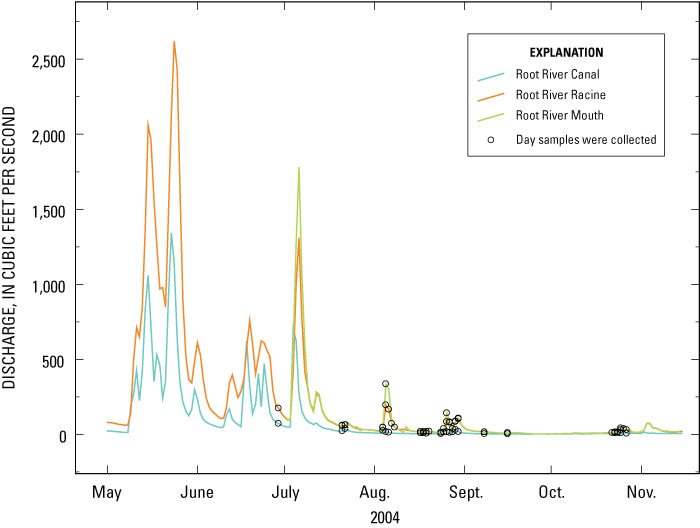
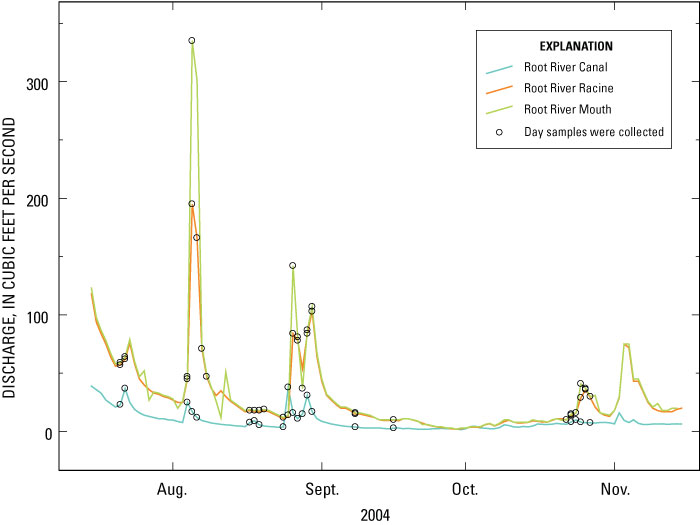
Figure 8. Hydrographs of discharge with sample-collection dates at three sites in the Root River Basin, Wis., from May 1 through November 15, 2004. Location of the sites shown in figure 1.
Figure 9. Hydrographs of discharge with sample-collection dates at six sites in the upper Milwaukee River and Cedar Creek Basins, Wis., in the post-flood period starting on July 15, 2004. Location of the sites shown in figure 1.
Figure 10. Hydrographs of discharge with sample-collection dates at three sites in the Root River Basin, Wis., in the post-flood period starting on July 15, 2004. Location of the sites shown in figure 1.
The large-scale flooding disrupted the installation, calibration, and operation of the monitoring equipment during the first 2 months of the study. Equipment repeatedly had to be removed from, or elevated above, rising flood waters at most sites before eventual reinstallation after the flood waters subsided in late June and early July. Some equipment, such as stage transducers and Hydrolab sondes that were installed before the flooding became completely inaccessible until flood water eventually receded in late June and early July.
Mean daily discharge has been computed at Cedar Creek (fig. 7, table 4) intermittently since August 14, 1930, (gaps in the record exist from Sept. 30, 1971 to July 1, 1973; Oct. 7, 1981 through July 31, 1983; and October 21, 1987 through Sept. 13, 1990). Based on this intermittent record, the daily discharge of 2,120 ft3/s recorded at Cedar Creek on May 27, 2004 ranked ninth (table 4) of the highest 10 mean daily discharges on record, and was the largest discharge recorded since March 30, 1960.
Discharge has been continuously monitored by USGS personnel at the Root River Canal near Franklin, Wis. since October 1, 1963. A summary of the highest mean discharges on record (table 5) indicates that the discharge recorded during the study period on May 23, 2004, ranked second highest, and was the largest discharge recorded since March 4, 1974.
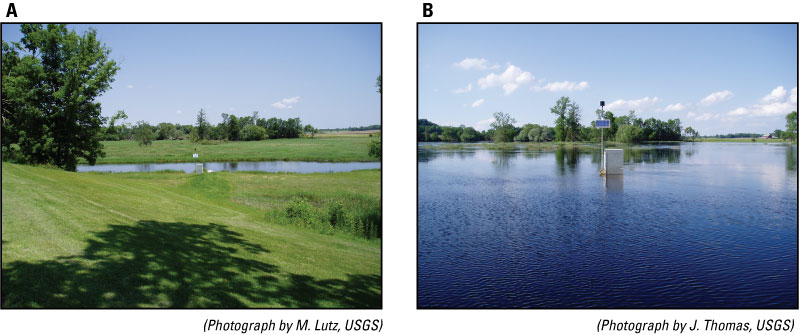
The magnitude of flooding at the Kewaskum site during June of 2004 is shown in figure 11. The river stage at Kewaskum peaked at approximately 1.5 feet above the flooding documented in the figure 11B photograph.
Figure 11. Extensive flooding occurred in the study area during June of 2004. These photographs show (A) before, and (B) during flooding at the Kewaskum streamflow gage in southeastern Wis. Location of the site shown in figure 1.
Discharge and water-quality data collected after two storms are discussed in detail later in the Water Quality During Storm Conditions section of this report. The first storm event (fig. 6) was a northeasterly trending storm front or broken line of cells that briefly pulsed to “severe storm” status on October 23, 2004 (National Weather Service, Weather Spotter’s Network—data and notes for October 23, 2004, from Green Lake County, Wis.). Precipitation was locally heavy at times and was irregularly distributed throughout the SEWRPC study area. Stage increases in response to the precipitation were smallest in the northern part of the Milwaukee River Basin around New Fane and largest in the southern parts of the study area near the Cedar Creek and Root River Basins.
A second front of storm cells followed on October 28, 2004 (fig. 6). Weather Spotter Network Notes from Jefferson County, Wis. on October 28, 2004 noted a severe weather outbreak, with locally powerful downburst wind drafts and some hail (National Weather Service, 2004). The storms moved along the boundary of a cold front from west to east across the study area at an estimated speed of from 58 to 69 miles per hour. Discharge hydrograph rises in response to precipitation from this storm occurred before the stage of most monitored streams had returned to base-flow conditions following the storm on October 23, 2004.
The October 23 and 28 storms were typical of the series of late summer and fall storms during 2004. Storm fronts moved in a general west to east, or southwest to northeast direction, and rainstorms consisted of broken storm cells that deposited highly variable quantities of precipitation across the Milwaukee River, Cedar Creek, and Root River Basins.
Analytical results for water-quality samples are provided in Waschbusch and others (2005). Intensive, partial, and mercury analysis schedules were performed on water-quality samples (tables 6 and 7).
Table 6. Numbers and types of water-quality samples from the nine sites in southeastern Wisconsin.
[Sample numbers include both regular and quality-assurance samples; location of sites shown in figure 1]
| Scheduled samples per site | |||
| New Fane | |||
| Kewaskum | |||
| Farmington | |||
| Newburg | |||
| Waubeka | |||
| Cedar Creek | |||
| Root River Canal | |||
| Root River Racine | |||
| Root River Mouth |
Table 7. Sampling dates and types of water-quality analysis for sites in the upper Milwaukee River, Cedar Creek and Root River Basins, Wis.
[mm/dd/yyyy, month, day, year; --, samples not collected; BOD, biological oxygen demand; exact start dates varied slightly between sites]
(mm/dd/yyyy) |
||
Cedar Creek Basins (6 sites) |
||
| Base-flow analysis | Base-flow analysis | |
| -- | Partial storm analysis | |
| Partial storm analysis | Partial storm analysis | |
| Partial storm analysis | Partial storm analysis | |
| Intensive analysis (Cedar Creek only) | Intensive storm analysis | |
| Base-flow analysis | Base-flow storm analysis | |
| Special bacteria analysis/BOD only | Special bacteria analysis/BOD only | |
| Partial storm analysis | -- | |
| Intensive storm analysis | Intensive storm analysis | |
| Partial storm analysis | Partial storm analysis | |
| Intensive storm analysis | -- | |
Stream hydrographs and sampled days for the upper Milwaukee and Cedar Creek Basins are shown in figure 7, and those for the Root River Basin sites are shown in figure 8. Because plotting of the extreme flooding in May and June compressed the data on figures 7 and 8, the same discharge data are presented in figures 9 and 10 with the May and June flood events excluded to better represent typical hydrologic conditions and sampled days at the sampling sites during the post-flood period starting in July 2004.
In addition to the unexpected flooding and subsequent lack of rainfall in July and August, other factors caused interruptions in the sampling schedule. Normal frontal storms in the 0.25 to 0.75-in. total rainfall range resumed in September, October, and November, and the scheduled sample collection plan was eventually completed for the nine sampling sites (tables 6 and 7). The automatic sample-collection procedure at Waubeka, however, was sometimes problematic, causing a lower sampling density during storm events than was originally planned. The Root River Racine site experienced extremely low flows at times because water was stored behind a dam/control upstream, and stage did not respond proportionally to storm events as the stage did at other sites. The sample intake lines at the Waubeka and Root River Racine site also had to be repositioned (lengthened) several times to resubmerge them in the receding stream channels as stage continued to decrease for several months after the May-June floods.
Two base-flow samples were collected to represent water quality during a spring and a summer base-flow event. These base-flow samples were collected on June 30 and July 1, 2004, and on September 8 and 9, 2004 (tables 8 and 9; Waschbusch and others, 2005).
Table 8. Results of water-quality analysis of samples collected during base flow June 30–July 1, 2004, in Wis.
[mg/L, milligram per liter; µg/L, microgram per liter; mL, milliliter; <, less than; --, sample collected but not analyzed; location of sites shown in figure 1]
Sampling sites |
|||||||||||
| Biological oxygen demand, mg/L | |||||||||||
| Fecal coliforms, colonies per 100 mL | |||||||||||
| Escherichia coli, colonies per 100 mL | |||||||||||
| Chloride, mg/L | |||||||||||
| Suspended solids mg/L | |||||||||||
| Nitrate plus nitrate, mg/L | |||||||||||
| Ammonia, mg/L | |||||||||||
| Kjeldahl nitrogen, mg/L | |||||||||||
| Total phosphorus, mg/L | |||||||||||
| Ortho-phosphorus, mg/L | |||||||||||
| Total copper, µg/L | |||||||||||
| Total zinc, µg/L | |||||||||||
| Chlorophyll a, µg/L | |||||||||||
Table 9. Water quality in samples collected during base-flow sampling Sept. 8–9, 2004.
[mg/L, milligrams per liter; µg/L, micrograms per liter; mL, milliliter; <, less than; --, sample collected but not analyzed; location of sites shown in figure 1]
| Biological oxygen demand, mg/L | |||||||||||
| Fecal coliforms, colonies per 100 mL | |||||||||||
| Escherichia coli, colonies per 100 mL | |||||||||||
| Chloride, mg/L | |||||||||||
| Suspended solids mg/L | |||||||||||
| Nitrate plus nitrite, mg/L | |||||||||||
| Ammonia, mg/L | |||||||||||
| Kjeldahl nitrogen, mg/L | |||||||||||
| Total phosphorus, mg/L | 0.22 |
||||||||||
| Ortho-phosphorus, mg/L | |||||||||||
| Total copper, µg/L | |||||||||||
| Total zinc, µg/L | |||||||||||
| Chlorophyll a, µg/L | |||||||||||
Discharge was at flood stages during the June 30–July 1 sampling (figs. 7 and 8), because of the extreme rainfall that occurred in May and June. May–June floodwaters were still receding on June 30, resulting in a higher “base flow” than for flows during most of the typical storms recorded later in the study. Additionally, the high base flow saturated normally dry areas by flooding the adjacent flood plains, thereby increasing the areas that could contribute contaminants to the streams. The September 8–9 base-flow sample was collected under more typical conditions and potentially provided a more typical representation of base flow for monitored streams in the study area.
Whereas substantial contamination was not apparent in the water quality of base flow at the Root River Basin sites (table 8), concentrations of suspended solids, chloride, total phosphorus, orthophosphorus, ammonia nitrogen, nitrate plus nitrate nitrogen, and total copper were generally higher at the Root River sites than at the upper Milwaukee River/Cedar Creek Basin sites (fig. 1).
The presence of elevated suspended solids and nutrients in Root River Basin samples can be attributed to agricultural activities in the basin. Although the land-use data in table 2 indicate that only 49.2 percent of land use is agricultural in the Root River Basin as compared to 50.5 percent in the upper Milwaukee River Basin and 50.1 percent in the Cedar Creek Basin, the category of “agriculture” in the geographic information systems spatial coverage that was used to compute these percentages does not separate the intensity of the agricultural activities. Results of water-quality analysis of the base-flow samples in tables 8 and 9 indicate that agricultural activities may be somewhat more nutrient- and tillage-intensive in the Root River Basin than in the upper Milwaukee and Cedar Creek Basins. Other possible sources contributing to elevated levels of suspended solids, chloride, nutrients, and copper in the Root River Basin could include contamination associated with a higher population density (fig. 4) with increased urban land use (table 2) in the main stem headwaters of the Root River Basin.
Project sampling was designed to characterize water quality during storms when dynamic chemical and physical water-quality changes are expected; therefore, most water-quality samples were collected during stormflow conditions. Datasets for input to the HSPF model require collection of storm data during discharge rises, peaks, and recessions, regardless of the significance or magnitude of any water-quality changes during the various discharge conditions.
With the exception of the Root River Mouth site, analyses of the data indicated that water-quality did not change substantially during stormflow compared to base flow (table 10) at individual sites. Although some contaminants did slightly increase in concentration at times of storm-induced hydrograph peaks, others became slightly diluted at the peak (table 10; fig. 12).
Table 10. Selected water-quality parameters in the upper Milwaukee River Basin, Wis., during base flow on September 9, 2004, and during the storm that began on October 23, 2004.
[mg/L, milligrams per liter; mm/dd/yy, month/day/year; hh:mm, hour:minute; --, no data available; <, less than; location of sites shown in figure 1]
Sampling site |
(mm/dd/yy (hh:mm)) |
|||||
(mg/L) |
solids (mg/L) |
nitrite (mg/L) |
nitrogen (mg/L) |
(mg/L) |
||
| New Fane | 09/08/04 (base flow) | |||||
| 10/24/04 (03:40) | ||||||
| 10/24/04 (11:40) | ||||||
| 10/24/04 (13:35) | ||||||
| 10/24/04 (20:34) | ||||||
| 10/25/04 (0703) | ||||||
| 10/25/04 (17:01) | ||||||
| 10/27/04 (04:40) | ||||||
| 10/28/04 (14:21) | ||||||
| 10/29/04 (19:10) | ||||||
| Kewaskum | 09/08/04 (base flow) | |||||
| 10/23/04 (11:30) | ||||||
| 10/23/04 (18:45) | ||||||
| 10/24/04 (01:15) | ||||||
| 10/24/04 (07:45) | ||||||
| 10/24/04 (12:10) | ||||||
| 10/24/04 (20:49) | ||||||
| 10/25/04 (07:01) | ||||||
| 10/25/04 (18:01) | ||||||
| 10/26/04 (22:45) | ||||||
| 10/28/04 (07:15) | ||||||
| 10/28/04 (15:01) | ||||||
| 10/29/04 (11:45) | ||||||
| 10/30/04 (01:30) | ||||||
| 10/30/04 (14:30) | ||||||
Sampling site |
(mm/dd/yy (hh:mm)) |
|||||
(mg/L) |
solids (mg/L) |
nitrite (mg/L) |
nitrogen (mg/L) |
(mg/L) |
||
| Farmington | 09/08/04 (base flow) | |||||
| 10/22/04 (04:45) | ||||||
| 10/24/04 (00:30) | ||||||
| 10/24/04 (14:13) | ||||||
| 10/24/04 (20:57) | ||||||
| 10/25/04 (06:57) | ||||||
| 10/25/04 (16:17) | ||||||
| 10/28/04 (14:02) | ||||||
| 10/29/04 (13:15) | ||||||
| Newburg | 09/08/04 (base flow) | |||||
| 10/23/04 (12:21) | ||||||
| 10/24/04 (00:30) | ||||||
| 10/24/04 (14:40) | ||||||
| 10/24/04 (20:55) | ||||||
| 10/25/04 (06:56) | ||||||
| 10/25/04 (16:31) | ||||||
| 10/26/04 (15:00) | ||||||
| 10/28/04 (12:40) | ||||||
| Waubeka | 09/08/04 (base flow) | |||||
| 10/23/04 (06:30) | ||||||
| 10/23/04 (17:45) | ||||||
| 10/24/04 (05:45) | ||||||
| 10/24/04 (11:45) | ||||||
| 10/24/04 (15:30) | ||||||
| 10/24/04 (20:33) | ||||||
| 10/25/04 (03:15) | ||||||
| 10/25/04 (07:03) | ||||||
| 10/25/04 (15:41) | ||||||
| 10/28/04 (13:16) | ||||||
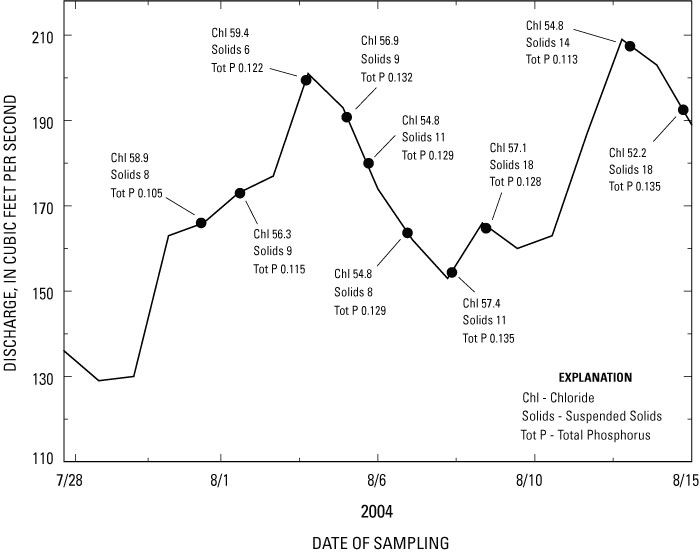
For example, discharge, chloride, suspended solids, and total phosphorus data were collected for a storm that occurred at the Newburg site beginning July 29, 2004 (fig. 12). Although the number of samples collected during this storm are insufficient to support a statistical analysis, there is a small increase in chloride (from 58.9 to 59.4 mg/L) and total phosphorus (from 0.105 to 0.122 mg/L) concentrations during the first storm peak that began on July 29. A second storm peak of similar magnitude followed approximately a week later on August 7, where concentrations of chloride decreased from 57.4 to 54.8 mg/L and total phosphorus decreased from 0.135 to 0.113 mg/L. Increases or decreases caused during the first storm may have affected the quality of water during the second storm and reduced sample independence.
The water-quality changes measured during these storms are small. Water quality at Newburg, as at the other five upper Milwaukee River Basin and Cedar Creek Basin sites, was relatively uncontaminated during base flow, and it remained relatively uncontaminated during stormflow.
Results of analyses of water-quality parameters and hydrographs of discharge during one of the two study “intensive-analysis” events and the start of a subsequent “partial analysis” event from October 22 through 29, 2004 are shown in tables 10, 11, and 12. The associated discharge and sample collection dates are shown in figures 12–14. Additional data from the September 9, 2004, base-flow samples are included in tables 10, 11, and 12 for comparison to storm data.
Table 11. Selected water-quality parameters at Cedar Creek Basin, Wis. during base flow on September 9, 2004, and during a storm event that began on October 23, 2004.
[mg/L, milligrams per liter; mm/dd/yy, month/day/year; hh:mm, hour:minute; --, no data available; <, less than; location of sites shown in figure 1]
of sampling (mm/dd/yy (hh:mm)) |
||||||
nitrogen (mg/L) |
||||||
| Cedar Creek | 09/08/04 (base flow) | |||||
| 10/24/04 (16:25) | ||||||
| 10/24/04 (20:30) | ||||||
| 10/25/04 (02:30) | ||||||
| 10/25/04 (06:49) | ||||||
| 10/25/04 (15:05) | ||||||
Table 12. Selected water-quality parameters in the Root River Basin, Wis. at base flow on September 9, 2004, and during a storm event that began on October 23, 2004.
[mg/L, milligrams per liter; mm/dd/yy, month/day/year; hh:mm, hour:minute; --, no data available; <, less than; location of sites shown in figure 1]
of sampling (mm/dd/yy (hh:mm)) |
||||||
(mg/L) |
(mg/L) |
nitrogen (mg/L) |
(mg/L) |
|||
| Root River Canal | ||||||
| Root River Racine | ||||||
| Root River Mouth | ||||||
Figure 12. Changes in chloride, suspended solids, and total phosphorus concentrations during storm events, July 29 through August 15, 2004, at the Newburg, Wis. site. All concentrations are in milligrams per liter. Location of the site shown in figure 1.
Figure 13. Discharge data and sample dates at the five upper Milwaukee River Basin sites, southeastern Wis., from October 22 through October 29, 2004. Location of the sites shown in figure 1.
Figure 14. Discharge data and sample dates at the Cedar Creek site, southeastern Wis., from October 22 through October 29, 2004. Location of the site shown in figure 1.
Results of the October 22–29 storm sample water-quality data compared to the September 8–9, 2004, base-flow data for the five upper Milwaukee River Basin sites are shown in table 10. At each of these sites, the analytical results from the base-flow sampling were similar to the storm sample data, indicating that water quality at these sites was unaffected by storm events.
Discharge and sampling dates for the Cedar Creek site during the October 22 through 29, 2004, storms are shown in figure 14. Leaves clogged the sample-line intake at Cedar Creek during the first part of the October 22 storm, so water-quality data are only available for the five samples collected on October 24 and 25 when the hydrograph began to decline after the intake was cleared (table 11). Although chloride concentrations appeared to be slightly elevated in the first (highest-flow) three samples, these differences are small and overall water quality during the October 22 through 30 storm was not substantially different than that during base flow at Cedar Creek.
Figure 15. Discharge data and sample dates at the Root River Canal, Root River Racine, and Root River Mouth sites, southeastern Wis. from October 22 through October 29, 2004. Location of the sites shown in figure 1.
Discharge and sampling dates for the Root River Canal, Root River Racine, and Root River Mouth sites during the October 22–29, 2004, storms are shown in figure 15. The discharge records indicate that the precipitation fell unevenly across the basin during these two storms, with less precipitation falling in the basin of the Root River Canal upstream tributary and more precipitation falling in the basin along the Root River main stem upstream of the Root River Racine and Root River Mouth sites.
Chloride concentrations increased at the Root River Canal and Root River Racine sites during the October storm compared to the September base-flow sample (table 12), while the base-flow concentration at the Root River Mouth site decreased.
Suspended-solids and total phosphorus concentrations in table 12 are similar in range to those at the Milwaukee River (table 10) and Cedar Creek Basins sites (table 11); however, concentrations of chloride were substantially higher at the three Root River sites. According to historical data published by Schneider and others (2004, p. 77), chloride concentrations ranged from 0 to 42 mg/L in the lower Milwaukee River Basin in the northernmost MMSD Planning Area to which the upper Milwaukee River and Cedar Creek Basins eventually discharge. These concentrations are substantially lower than those of 125 to 300 mg/L in the headwaters of the Root River Basin near West Allis in the southernmost part of the MMSD Planning Area upstream of the Root River Racine site.
The October 22–29 storm data from the Root River Racine site indicate that concentrations of some constituents increased as discharge increased during the late October stormflow. Concentrations of suspended solids and phosphorus both increased slightly, from 14 to 20 mg/L and from 0.087 to 0.131 mg/L, respectively, during the storm as discharge increased from 12 to 32 ft3/s.
Base-flow parameter concentrations from the Root River Mouth site (table 12) indicate that concentrations of all parameters were higher during the September 9 base-flow sampling than the concentrations reported for the late October storm sampling. It is likely that contaminants concentrate during extended low-flow conditions in the intensely urban Root River Mouth site, either from urban sources, from upstream sources, or from Lake Michigan, and, then during storm events, are flushed out and diluted in the harbor area. During field sampling observations, substantial amounts of trash, debris, and dead fish sometimes accumulated near the Root River Mouth site that were then subsequently flushed out into Lake Michigan during storms.
Hydrolab water-quality sondes were used for continuous (every 15 minutes) collection of specific conductance (figs. 16 and 17), temperature (fig. 18), and dissolved oxygen (figs. 19 and 20) data at the upper Milwaukee River, Cedar Creek, and Root River Basin sites.
Figure 16. Daily specific conductance recorded at the six upper Milwaukee River and Cedar Creek Basin sites, southeastern Wis. Location of the sites shown in figure 1. Gaps in the data indicate periods of data-collection equipment malfunction.
Figure 17. Daily specific conductance recorded at the three Root River Basin sites, southeastern Wis. Location of the sites shown in figure 1. Gaps in the data indicate periods of data-collection equipment malfunction.
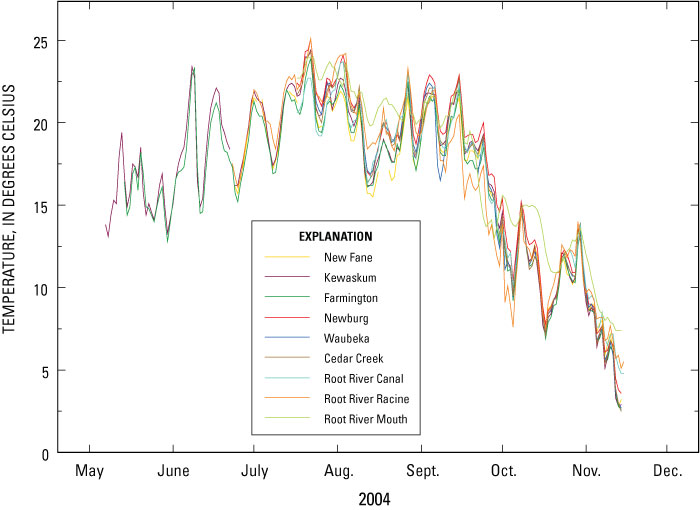
Figure 18. Daily temperature recorded at the nine sampling sites in southeastern Wis. Location of the sites shown in figure 1.
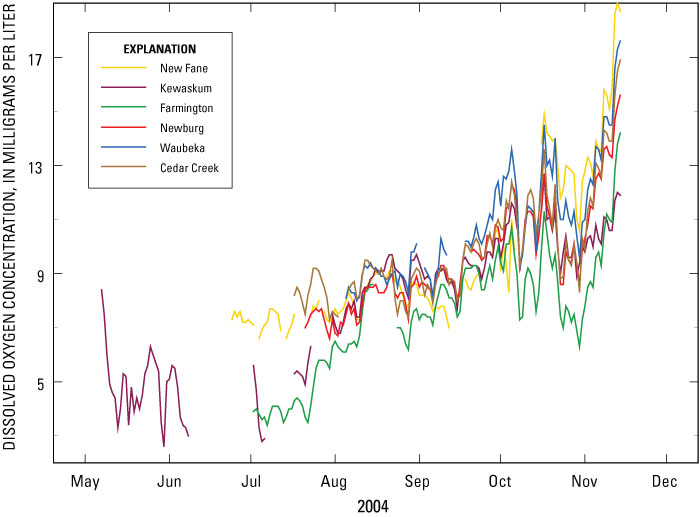
Figure 19. Daily dissolved oxygen concentration recorded at the upper Milwaukee River Basin and Cedar Creek Basin sites, southeastern Wis. Location of the sites shown in figure 1. Gaps in the data indicate periods of data-collection equipment malfunction.
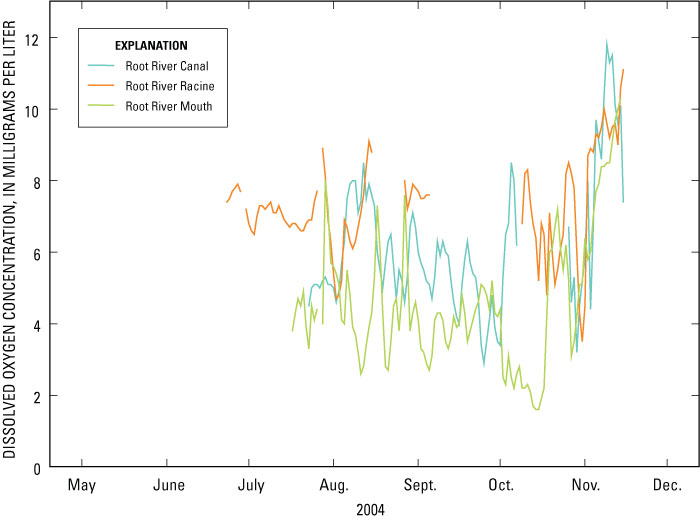
Figure 20. Daily dissolved oxygen concentration recorded at the three Root River Basin sites, southeastern Wis. Location of the sites shown in figure 1. Gaps in the data indicate periods of data-collection equipment malfunction.
Specific conductance is a measure of the ability of a body (water) of unit length and unit cross section at a specified temperature to conduct electricity (Hem, 1992). The specific conductance of pure water is low; however, conductance increases substantially under ambient environmental conditions with increasing concentrations of charged ions such as chloride or nitrate.
Specific conductance (figs. 16 and 17) values were similar to those reported in Schneider and others (2004, fig. 24, p. 53) for the northern half of the MMSD Planning Area, but were generally less than concentrations in the more urbanized southern half of the MMSD Planning Area where the values have historically ranged from 901 to 3,405 microSiemens per centimeter at most sampling sites (Schneider and others, 2004).
Water temperatures were generally consistent between all sites (fig. 18). Differences in channel geometry can cause some streams to have higher surface-area to volume ratios that can cause minor temperature variations between sites. Instrument noise (within acceptable limits) may also contribute to minor temperature differences.
Dissolved oxygen (DO) concentrations recorded at the nine sites (figs. 19 and 20) were generally consistent with expectations for relatively uncontaminated stream water that is open to the atmosphere. Because cold water has a larger capacity to store dissolved oxygen than warm water, concentrations of dissolved oxygen increased in October and November due to the colder temperatures of late fall and winter.
The lowest DO concentrations were recorded at Kewaskum (fig. 19) and at the Root River Mouth (fig. 20) sites during the study. Lower DO concentrations at the Kewaskum site are not explained by geologic setting, land use, population, or other water-quality data collected at this site; however, the DO probe was intermittently buried by sediments, which could have contributed to intermittently low dissolved oxygen readings. Concentrations of DO below the minimum standard of 5 mg/L (Ball and LaLiberte, 2004, p. 21) are commonly considered to be detrimental to fish and other aquatic organisms.
The Root River Mouth site Hydrolab sonde was installed immediately downstream of multiple marinas, boat docks, numerous blocks of city buildings, and various urban pipe discharges that may have released contaminants that might have contributed to reductions in the dissolved oxygen concentrations. For example, the Root River Mouth site consistently had elevated concentrations of ammonia (from unidentified sources) that could have contributed to a decrease in oxygen concentrations in the river as ammonia consumed oxygen in the oxidization of ammonium to nitrate. Dissolved oxygen readings every 15 minutes, every day, for consecutive months were collected by means of a membrane probe, which was sensitive to fouling by debris, sedimentation, or algal growth. Additionally, DO readings can be biased by subtle differences in the membrane surface tension on the tip of the sonde. Record gaps on figures 19 and 20 represent periods where the Hydrolabs were inaccessible during flood events (May to July) or times when the hydrolabs were judged to be producing record of insufficient quality (Wagner and others, 2000).
Biological oxygen demand (BOD), fecal coliform bacteria, and Escherichia coli are water-quality parameters of substantial interest in the Great Lakes Region (International Joint Commission, 2004; Haack and others, 2003; Lauber and others, 2003), including the sampled rivers that drain to Lake Michigan. In addition to the traditional bacterial concerns associated with water used as public supplies, bacterial issues in the last decade have become a major concern in recreational waters such as the Lake Michigan beaches of the greater Milwaukee area.
The measured BOD of site samples (table 13) was low with most samples having BOD below the detection limit of the test and a maximum concentration of only 4 mg/L in a sample collected at the Root River Mouth site. No State or Federal aquatic water-quality criteria exist for 24 to 48 hours, BOD5 (5-day test) for ambient water-quality in aquatic environments. BOD detection limits are computed as a function of replicate analyses for specific sample groups; therefore, BOD detection limits may vary between different sample sets.
Table 13. Biological oxygen demand, fecal coliforms, and Escherichia coli in samples collected at nine sampling sites in Wisconsin.
[mL, milliliter; <, less than; mg/L, milligrams per liter; m-TEC, an agar method with a two-step membrane-filtration method for detection of Escherichia coli; Probable no., the most probable number non-filtration method uses a specified number of test tubes to statistically predict the number of organisms present; --, mean was not computed; location of the sites shown in figure 1.]
samples |
||||||
| New Fane | Biological oxygen demand | 5-day, mg/L | ||||
| Fecal coliform | colonies/100 mL | |||||
| Escherichia coli Probable No. | colonies/100 mL | |||||
| Escherichia coli m-TEC | colonies/100 mL | |||||
| Kewaskum | Biological oxygen demand | 5-day, mg/L |
|
|||
| Fecal coliform | colonies/100 mL | |||||
| Escherichia coli Probable No. | colonies/100 mL | |||||
| Escherichia coli m-TEC | colonies/100 mL | |||||
| Farmington | Biological oxygen demand | 5-day, mg/L |
|
|||
| Fecal coliform | colonies/100 mL | |||||
| Escherichia coli Probable No. | colonies/100 mL | |||||
| Escherichia coli m-TEC | colonies/100 mL | |||||
| Newburg | Biological oxygen demand | 5-day, mg/L |
|
|||
| Fecal coliform | colonies/100 mL | |||||
| Escherichia coli Probable No. | colonies/100 mL | |||||
| Escherichia coli m-TEC | colonies/100 mL | |||||
samples |
||||||
| Waubeka | Biological oxygen demand | 5-day, mg/L | ||||
| Fecal coliform | colonies/100 mL | |||||
| Escherichia coli Probable No. | colonies/100 mL | |||||
| Escherichia coli m-TEC | colonies/100 mL | |||||
| Cedar Creek | Biological oxygen demand | 5-day, mg/L | ||||
| Fecal coliform | colonies/100 mL | |||||
| Escherichia coli Probable No. | colonies/100 mL | |||||
| Escherichia coli m-TEC | colonies/100 mL | |||||
| Root River Canal | Biological oxygen demand | 5-day, mg/L | ||||
| Fecal coliform | colonies/100 mL | |||||
| Escherichia coli Probable No. | colonies/100 mL | |||||
| Escherichia coli m-TEC | colonies/100 mL | |||||
| Root River Racine | Biological oxygen demand | 5-day, mg/L | ||||
| Fecal coliform | colonies/100 mL | |||||
| Escherichia coli Probable No. | colonies/100 mL | |||||
| Escherichia coli m-TEC | colonies/100 mL | |||||
| Root River Mouth | Biological oxygen demand | 5-day, mg/L | ||||
| Fecal coliform | colonies/100 mL | |||||
| Escherichia coli Probable No. | colonies/100 mL | |||||
| Escherichia coli m-TEC | colonies/100 mL |
Colonies of fecal coliform bacteria or Escherichia coli in water samples from the nine sampling sites only indicate that fecal contamination of water by humans or animals is present and that unidentified toxic strains of bacteria are also likely to be present. Reported numbers in table 13 are likely to be one or two orders of magnitude less than numbers of colonies actually present in the monitored streams because of microorganism decay during the 24- to 48-hour holding and preparation time prior to sample analysis. The largest concentrations of fecal coliforms (3,600 colonies per 100 mL) and Escherichia coli (2,300 colonies per 100 mL) were reported in samples collected at Kewaskum (table 13).
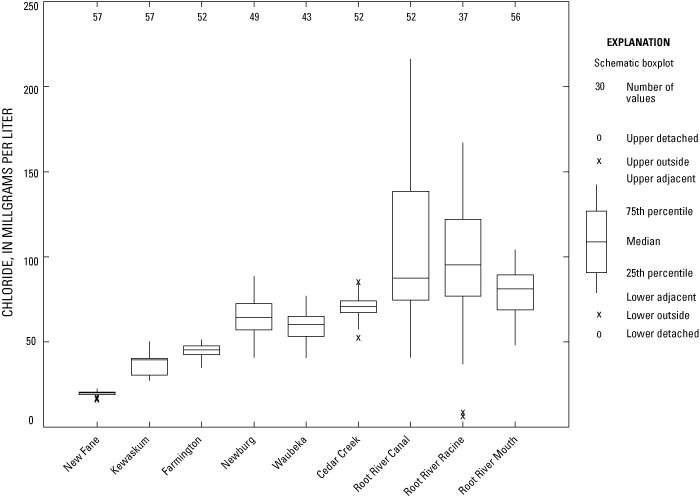
Chloride concentrations ranged from a minimum of 15.5 mg/L in a sample collected at New Fane to a maximum of 216 mg/L in a sample collected at the Root River Canal site.
Chloride concentrations in samples collected at the nine sites (fig. 21) were considerably below USEPA (2006) secondary chloride standards for drinking water, which are presumably stricter than what would be required for ambient stream water quality. For example, the maximum concentration of 216 mg/L chloride for all project samples (fig. 21) was below the USEPA secondary (aesthetic) standard of 250 mg/L in drinking water.
Figure 21. Distributions of chloride concentrations in samples collected at the nine sampling sites in southeastern Wis. Location of the sites shown in figure 1.
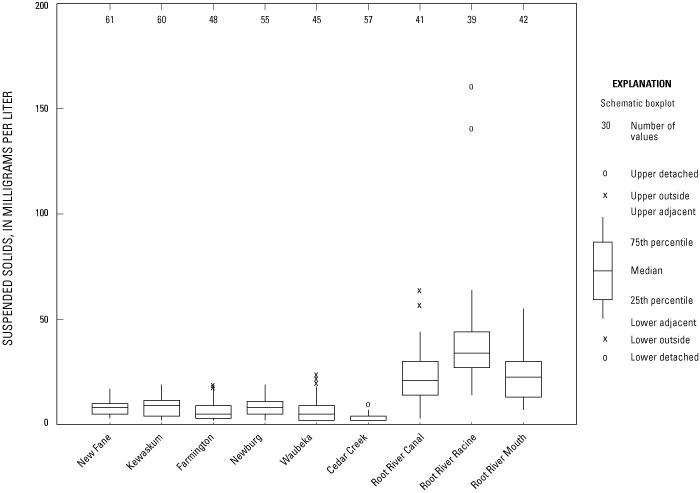
Concentrations of suspended solids in the upper Milwaukee, Cedar Creek, and Root River Basins ranged from a minimum of 2 mg/L in samples collected at Cedar Creek to a maximum of 162 mg/L in a sample collected at the Root River Racine site, with median concentrations of 10 mg/L or less for each of the six Milwaukee River/Cedar Creek sites (fig. 22). Although concentrations of suspended solids are higher at the three Root River sites than at the other sites, the concentrations at the Root River sites are low compared to the historic concentrations that ranged from 331 to 1,000 mg/L in the most of the MMSD Planning Area (Schneider and others, 2004, p. 83).
Figure 22. Distributions of suspended solids concentrations in samples collected at the nine sampling sites in southeastern Wis. Location of the sites shown in figure 1.
Two samples analyzed for suspended solids that were collected at the Root River Racine site are from samples collected on August 17, 2004, with concentrations of 162 mg/L and 142 mg/L (fig. 22). These samples were collected when the water was brown due to increased solids and sediment concentrations.
The U.S. Environmental Protection Agency (USEPA) has not published broad water-quality criteria for suspended solids concentrations in aquatic waters. Guidelines, however, are managed under a variety of programs including the USEPA/States total maximum daily loads (TMDL) program, USEPA National Pollution Discharge Elimination System permits (NPDES), and various USEPA/States Best-Management Practice (BMP) programs.
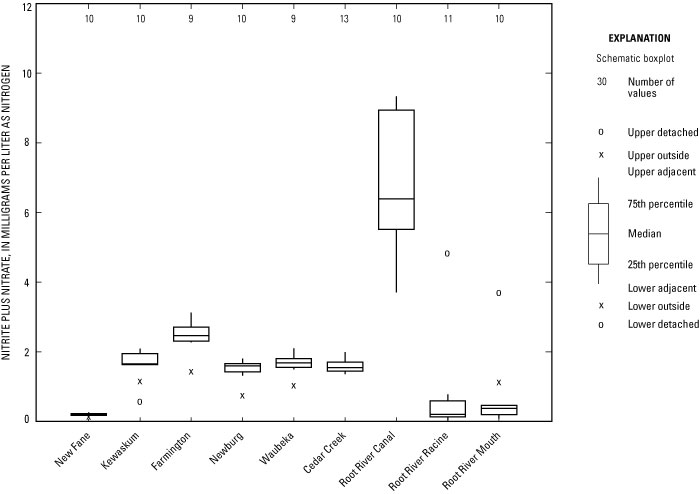
Nitrate plus nitrite concentrations in samples collected at the nine monitored sites ranged from 0.043 mg/L at the Root River Racine site to 9.32 mg/L at the Root River Canal site (fig. 23). One possible source of high concentrations of nitrite plus nitrate at the Root River Canal site may be from leaching of agricultural fertilizers and animal manures from the farm fields in the predominantly agricultural basin upstream of this site. Other possible sources of nitrate plus nitrite nitrogen to the river include leaching from septic fields or sewage-treatment facilities in this rural area. Nitrate plus nitrite concentrations in the urbanized headwaters of the Root River become substantially diluted by the time the river reaches the Root River Racine site.
Figure 23. Distributions of nitrate plus nitrite-nitrogen concentrations in samples collected at the nine sampling sites in southeastern Wis. Location of the sites shown in figure 1.
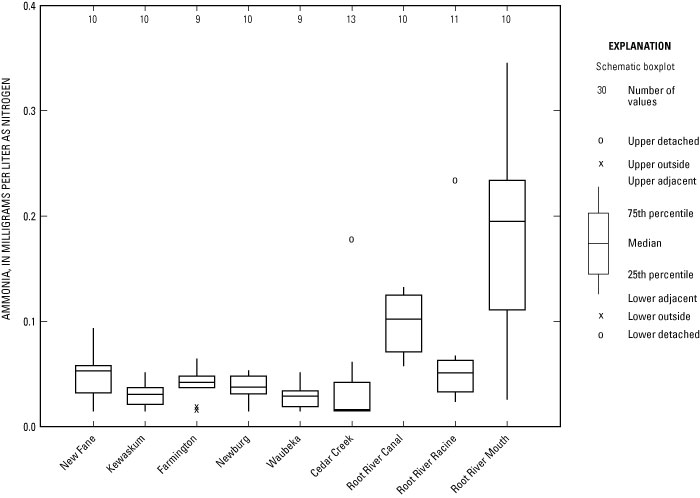
Ammonia nitrogen concentrations ranged from 0.015 mg/L in numerous samples at multiple sites to 0.345 mg/L in a sample collected at the Root River Mouth site (fig. 24). The contributing sources of ammonia apparently are downstream of the Root River Racine site. A comparison of figures 24 and 25 indicates that most of the Kjeldahl (organic plus ammonia) nitrogen is in the organic form, because the ammonia concentrations shown in figure 24 are substantially less than half of the Kjeldahl concentrations shown in figure 25.
Figure 24. Distributions of ammonia-nitrogen concentrations in samples collected at the nine sampling sites in southeastern Wis. Location of the sites shown in figure 1.
Figure 25. Distributions of organic plus ammonia Kjeldahl nitrogen concentrations in samples collected at the nine sampling sites in southeastern Wis. Location of the sites shown in figure 1.
Keldahl nitrogen concentrations (fig. 25) ranged from 0.48 mg/L in a sample collected at Cedar Creek to 1.5 mg/L in two samples collected at Root River Racine and one sample collected at the Root River Mouth site. Possible sources of Kjeldahl nitrogen in the SEWRPC study areas include agricultural leaching of fertilizers and animal manures, septic system discharges, and sewage-treatment plant discharges.
Most sample concentrations of Kjeldahl nitrogen exceeded the “reference conditions” of 0.65 mg/L Kjeldahl nitrogen at the 25th percentile for Level III, Ecoregion 53 (U.S. Environmental Protection Agency, 2000, p. 16). The reference-condition concentration is not a water-quality standard, but rather is published as a guidance concentration for State, local, and Tribal organizations to use in developing their own water-quality standards.
Total phosphorus concentrations ranged from 0.021 mg/L in a sample from Cedar Creek to 0.627 mg/L at the Root River Canal site (fig. 26). Many sample concentrations exceeded the recently published USEPA water-criteria guidelines of 0.080 mg/L total phosphorus for streams in southeastern Wisconsin (U. S. Environmental Protection Agency, 2000; fig. 26); however, this guidance criteria is not a water-quality limit or standard.
Figure 26. Distributions of total phosphorus concentrations in samples collected at the nine sampling sites in southeastern Wis. Location of the sites shown in figure 1.
Phosphorus data from the SEWRPC study areas are comparable to summarized historical total phosphorus data from sites within the MMSD Planning Area as published in Schneider and others (2004, p. 109). Schneider and others showed that total phosphorus concentrations ranged from 0.073 to 0.111 mg/L in the lower Milwaukee River Basin nearest to the upper Milwaukee River and Cedar Creek Basins and ranged from 0.112 to 2.500 mg/L in the southern part of the MMSD Planning Area in the headwaters of the Root River Basin near West Allis.
Because a large percentage of the total phosphorus in natural waters is typically not in a bioavailable form, orthophosphorus (reactive) may be measured as an indicator of the fraction of phosphorus that is readily available to aquatic vegetation. Orthophosphorus concentrations in samples collected at the nine sites ranged from 0.002 mg/L in two samples collected at the Root River Racine site to 0.136 mg/L in a sample collected at the Root River Canal site (fig. 27). State or Federal water-quality standards do not exist for ambient concentrations of orthophosphorus in aquatic environments.
Figure 27. Distributions of orthophosphorus concentrations in samples collected at the nine sampling sites in southeastern Wis. Location of the sites shown in figure 1.
Probable sources of copper to the nine sites include copper occurring in geologic materials, leaching of copper to water from plumbing fixtures, or various industrial processes (Hem, 1992, p. 141). Additionally, copper may enter the environment from agricultural pesticides or from compounds added to water specifically to retard or prevent algal growth.
Total copper concentrations were lower in the Milwaukee River and Cedar Creek Basins samples than in those measured from the three Root River sites (table 14). Concentrations of copper in the Root River samples ranged from less than detection limit to 38 µg/L in sample collected at the Root River Canal site. The maximum concentrations of copper in the Root River samples exceed some draft U. S. Environmental Protection Agency Ambient Water-Quality Criteria for acute toxicity to a variety of aquatic organisms and most chronic levels of copper (toxicity criteria vary by species) (U.S. Environmental Protection Agency, 2003).
Table 14. Maximum and minimum concentrations of total copper, particulate mercury, dissolved mercury, particulate methylmercury, dissolved methylmercury, and total zinc for nine sites in Wisconsin.
[µg/L, micrograms per liter; ng/L, nanograms per liter; <, less than; location of the sites shown in figure 1]
| New Fane | Total copper |
|
|||
| Particulate mercury | |||||
| Dissolved mercury | |||||
| Particulate methylmercury | |||||
| Dissolved methylmercury | |||||
| Total zinc | |||||
| Kewaskum | Total copper | ||||
| Particulate mercury | |||||
| Dissolved mercury | |||||
| Particulate methylmercury | |||||
| Dissolved methylmercury | |||||
| Total zinc | |||||
| Farmington | Total copper | ||||
| Particulate mercury | |||||
| Dissolved mercury | |||||
| Particulate methylmercury | |||||
| Dissolved methylmercury | |||||
| Total zinc |
|
|
|||
| Newburg | Total copper | ||||
| Particulate mercury | |||||
| Dissolved mercury | |||||
| Particulate methylmercury | |||||
| Dissolved methylmercury | |||||
| Total zinc | |||||
| Waubeka | Total copper | ||||
| Particulate mercury | |||||
| Dissolved mercury | |||||
| Particulate methylmercury | |||||
| Dissolved methylmercury | |||||
| Total zinc | |||||
| Cedar Creek | Total copper | ||||
| Particulate mercury | |||||
| Dissolved mercury | |||||
| Particulate methylmercury | |||||
| Dissolved methylmercury | |||||
| Total zinc | |||||
| Root River Canal | Total copper | ||||
| Particulate mercury | |||||
| Dissolved mercury | |||||
| Particulate methylmercury | |||||
| Dissolved methylmercury | |||||
| Total zinc | |||||
| Root River Racine | Total copper | ||||
| Particulate mercury | |||||
| Dissolved mercury | |||||
| Particulate methylmercury | |||||
| Dissolved methylmercury | |||||
| Total zinc | |||||
| Root River Mouth | Total copper | ||||
| Particulate mercury | |||||
| Dissolved mercury | |||||
| Particulate methylmercury | |||||
| Dissolved methylmercury | |||||
| Total zinc |
Mercury samples were collected twice at each site during the study and were analyzed for particulate mercury, dissolved mercury, particulate methylmercury, and dissolved methylmercury (table 14). Traces of mercury were present at all sites, although concentrations were low and no toxic “hotspots” were found. Concentrations of methylmercury, although low, may be important because of the high potential for methylmercury bioaccumulation in the food chain. The largest mercury concentrations (2.880 ng/L) were reported in a particulate mercury sample collected at the Root River Mouth site.
Total zinc levels were below the analytical detection limit of 20 µg/L in 91 of the 92 samples collected at the nine sites during the project. One sample collected at Cedar Creek had a concentration barely above the detection limit at 30 µg/L.
Chlorophyll a concentrations in samples collected at the nine sites were generally low (fig. 28) at less than 10 µg/L. Elevated concentrations of chlorophyll a, for example, 137 µg/L, in samples collected at the Root River Racine site may potentially be attributed to unmonitored contributions from the headwaters of the Root River in the urban areas around West Allis (fig. 4), or from the effect immediately upstream of the Highway 38 bridge that acts as a control dam during low-flow conditions. Water ponded behind the control structure is exposed to sunlight, has a source of nutrients from upstream areas such as the agricultural lands around the Root River Canal site, and is subject to increased algal growth. Chlorophyll a in the Root River then becomes progressively more diluted as it flows downstream to the Root River Mouth site, a zone of intermittent mixing between the Root River and Lake Michigan.
Figure 28. Chlorophyll a concentrations in samples collected at the nine sampling sites in southeastern Wis. Location of the sites shown in figure 1.
Discharge and water quality were measured at nine study sites in southeastern Wisconsin from May 1 through November 15, 2004, by the U.S. Geological Survey in cooperation with the Southeastern Wisconsin Regional Planning Commission (SEWRPC). The data were collected for calibration of hydrological models that will be used by water-resources managers to simulate how various management strategies will affect the water quality of streams. The data will also support development of the current SEWRPC Regional Water Quality Management Plan and the Milwaukee Metropolitan Sewerage District 2020 Facilities Plan.
Five of the nine sites were in the upper Milwaukee River Basin, including the East, West, and North Branches of the Milwaukee River headwaters. One site was on Cedar Creek near Cedarburg, Wis., upstream of the confluence of Cedar Creek with the upper Milwaukee River. The remaining three sites were in the Root River Basin to the south of the Milwaukee metropolitan area, and included sites at the Root River Canal tributary, in Racine downstream of the Highway 38 bridge, and in the downtown Racine area near the discharge point of the Root River into Lake Michigan.
Hydrologic conditions from May 1 through November 15, 2004, were affected by flooding in southeastern Wisconsin during the spring. The flooding was caused by irregularly distributed, excessive rainfall during May and June 2004. A nearly continuous 75-year long record from Cedar Creek indicated that a daily discharge of 2,120 ft3 recorded on May 27, 2004, ranked ninth of the highest ten mean daily discharges on record, and was the largest discharge recorded since March 30, 1960. Discharge records from continuous monitoring on the Root River Canal near Franklin since October 1, 1963, indicate that the discharge recorded on May 23, 2004, ranked second highest on record, and was the largest discharge recorded since March 4, 1974.
Analysis of water-quality data indicated that concentrations of most parameters (dissolved oxygen, biological oxygen demand, fecal coliform bacteria, chloride, suspended solids, nitrate plus nitrite nitrogen, ammonia nitrogen, Kjeldahl nitrogen, total phosphorus, dissolved orthophosphorus, total copper, particulate mercury, dissolved mercury, particulate methylmercury, dissolved methylmercury, and total zinc) were below applicable U. S. Environmental Protection Agency and State of Wisconsin water-quality standards at all sites. Exceptions included dissolved oxygen concentrations at the Kewaskum, Farmington, Root River Canal, Root River Racine, and Root River Mouth sites; each site had from several days to several weeks of daily average dissolved oxygen concentrations below 5 mg/L. The Wisconsin Department of Natural Resources recommends preserving 5 mg/L of dissolved oxygen in river water to support fish, aquatic plants, and other aquatic organisms. The lowest dissolved oxygen concentrations were measured at the Root River Mouth site, where elevated concentrations of ammonia may have been actively consuming oxygen in the oxidation of ammonia to nitrate. Oxygen levels measured at this site were below 5 mg/L on many days.
In addition to continuous monitoring of discharge, temperature, specific conductance, and dissolved oxygen, water-quality samples were taken at each of the nine sites during two base-flow events and six storm events. Concentrations of chloride, suspended solids, and total phosphorus were analyzed in all samples. In addition, samples taken during the base-flow events and two of the storm events were analyzed for biological oxygen demand, fecal coliforms, Escherichia coli, nitrate plus nitrite nitrogen, ammonia nitrogen, Kjeldahl nitrogen, orthophosphorus, total copper, total zinc, and chlorophyll a to provide a more intensive characterization of water quality. Particulate mercury, dissolved mercury, particulate methylmercury, and dissolved methylmercury were analyzed in samples from one base-flow event and from one storm event at each site.
Water-quality did not change substantially, or consistently, during stormflow in comparison to base flow at any of nine sampling sites. Of all samples, the highest concentrations of fecal coliforms (3,600 colonies per 100 mL) and Escherichia coli (2,300 colonies per 100 mL) were reported in samples collected at the Kewaskum site. The highest mercury concentrations (2.880 ng/L) were reported in a particulate mercury sample collected at the Root River Mouth site. The highest concentration of total suspended solids (162 mg/L) was reported in a sample collected at the Root River Racine site. The highest concentrations of chloride (216 mg/L), total phosphorus (0.627 mg/L), orthophosphorus (0.136 mg/L), nitrate plus nitrite (9.32 mg/L), and copper (38 µg/L) were reported for samples collected at the Root River Canal site, which is downstream of an agricultural area. The highest concentration of chlorophyll a (139 µg/L) was reported in a sample collected at the Root River Racine site.
Ball, J., and LaLiberte, P., 2004, State of Wisconsin guidelines for designating fish and aquatic life uses for Wisconsin surface waters: Wisconsin Department of Natural Resources, Bureau of Watershed Management PUBL-WT-807-04, 75 p.
Burzynski, M., 2001, The state of the Milwaukee River Basin: Wisconsin Department of Natural Resources, PUBL-WT-704-2001, 108 p.
Burzynski, M., and Helker, C., 2002, The state of the Root-Pike River Basin: Wisconsin Department of Natural Resources, PUBL-WT-700-2002, 84 p.
DeWild, J.F., Olson, M.L., and Olund, S.D., 2002, Determination of methylmercury by aqueous phase ethylation, followed by gas chromatographic separation with cold vapor atomic fluorescence detection: U.S. Geological Survey Open-File Report 01–445, 14 p.
Garn, H.S., 2002, Surface-water quality-assurance plan for the Wisconsin District of the U. S. Geological Survey, Water Resources Division: U.S. Geological Survey Open-File Report 02–30, 52 p.
Guy, H.P., and Norman, V.W., 1970, Field methods for measurement of fluvial sediment: U.S. Geological Survey Techniques of Water-Resources Investigations, book 3, chapter C2, 59 p.
Haack S.K., Fogarty L.R., and Wright, C., 2003, Escherichia coli and enterococci at beaches in the Grand Traverse Bay, Lake Michigan: Sources, characteristics, and environmental pathways. Environmental Science and Technology v. 37, n. 15, p. 3275–3282.
Hem, J.D., 1992, Study and interpretation of the chemical characteristics of natural water, 4th ed.: U.S. Geological Survey Water-Supply Paper 2254, 264 p.
International Joint Commission, 2004, Twelfth Biennial Report on Great Lakes Water Quality: Ottawa, International Joint Commission, 84 p.
Lauber, C. L., Glatzer, L., and Sinsabaugh, R. L., 2003, Prevalence of pathogenic Escherichia coli in recreational waters: Journal of Great Lakes Research, v. 29, n. 2, p. 301–306.
Lineback, J.A., Bleuer, N.K., Mickelson, D.M., Farrand, W.R., and Goldthwait, R.P., 1983, Quaternary geologic map of the Chicago 4 degree by 6 degree Quadrangle, United States, [edited and integrated by Richmond, G.M. and Fullerton, D.S.]: U.S. Geological Survey Miscellaneous Investigations Series Map I–1420(NK–16).
Martin, L., 1965, The physical geography of Wisconsin: Madison, Wis., University of Wisconsin Press, 608 p.
National Weather Service, 2004, Milwaukee-Sullivan station data and Rain Spotter Network data: National Weather Service, accessed June 5, 2006 at http://www.crh.noaa.gov/mkx/
Olson, M.L., and DeWild, J.F., 1999, Low-level collection techniques and species-specific analytical methods for mercury in water, sediment, and biota: U. S. Geological Survey Water Resources Investigations Report 99–4018–B, 11 p.
Schneider, M.A., Lutz, M.A., and others, 2004, Water-resources-related information for the Milwaukee Metropolitan Sewerage District Planning Area, Wisconsin, 1970–2002: U. S. Geological Survey Water-Resources Investigations Report 03–4240, 288 p.
U.S. Census Bureau, 2000, Census 2000 redistricting data: U. S. Census Bureau, accessed June 6, 2006, at http://www.census.gov/rdo/www/redistricting%20data.htm
U.S. Environmental Protection Agency, 2000, Ambient water quality criteria recommendations, rivers and streams in nutrient ecoregion VII: U.S. Environmental Protection Agency, Office of Water, EPA-822-B-00-018, 93 p.
U.S. Environmental Protection Agency, 2006, Secondary drinking water regulations: guidance for nuisance chemicals: U. S. Environmental Protection Agency, accessed June 6, 2006, at http://www.epa.gov/safewater/consumer/2ndstandards.html
U. S. Environmental Protection Agency, 2003, 2003 Draft update of ambient water quality criteria for copper: U. S. Environmental Protection Agency, 822-R-03-026, 71 p.
U.S. Geological Survey, variously dated, National field manual for the collection of water-quality data: U.S. Geological Survey Techniques of Water-Resources Investigations, book 9, chaps. A1–A9, variously paginated.
Wagner, R.J, Mattraw, H.C., Ritz, G.F., and Smith, B.A., 2000, Guidelines and standard procedures for continuous water-quality monitors: site selection, field operation, calibration, record computation, and reporting: U.S. Geological Survey Water-Resources Investigations Report 00–4252, 53 p.
Waschbusch, R.J., Olson, D.L., Marsh, S.B., and Stark, P.A., 2005, Water-resources data, Wisconsin, water year 2004: U.S. Geological Society Water Data Report WDR–WI–04, 1,017 p.
Wigal, J., 2002, Implementation guidance for ambient water quality criteria for bacteria (draft): U.S. Environmental Protection Agency, EPA-823-B-02-003, 101 p.
Document Accessibility: Adobe Systems Incorporated has information about PDFs and the visually impaired. This information provides tools to help make PDF files accessible. These tools convert Adobe PDF documents into HTML or ASCII text, which then can be read by a number of common screen-reading programs that synthesize text as audible speech. In addition, an accessible version of Adobe Reader, which contains support for screen readers, is available. These tools and the accessible reader may be obtained free from Adobe at Adobe Access.

![]() U.S. Department of the Interior | U.S. Geological Survey
U.S. Department of the Interior | U.S. Geological Survey
Persistent URL: http://pubs.water.usgs.gov/ofr20061121
Page Contact Information: USGS Publishing Network
Page Last Modified: Saturday, 12-Jan-2013 22:13:29 EST