|
|
|
|
|
| Report Home | Maps | Overview | Mapping Methods | Coastal Classifications | Geologic Setting | Coastal Processes | Coastal Vulnerability | Classification Summary | References | |||||||||||||||||||||||||||||||
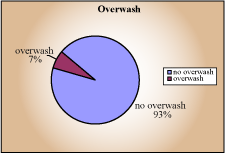
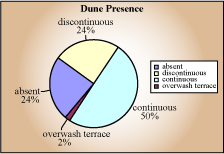
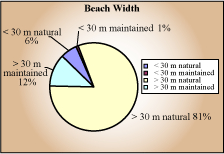
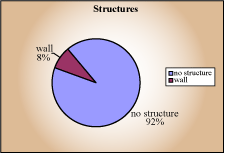
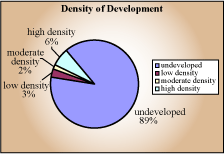
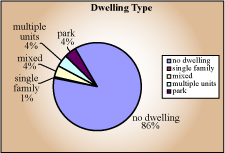
Classification SummaryThe coastal classification maps provide a basis for establishing the lengths of shore that have a particular morphological characteristic or urban attribute. Such information is relevant for local and state governments for planning that involves the amount of shore that is developed versus undeveloped, or the amount of parkland held in the public trust. Also, there is interest regarding the amount of shore that is affected by engineering structures, referred to as armoring or hardening of the shore. Environmental-protection and resource-management issues such as these require quantitative data that can be derived from the classification maps. The shore lengths and equivalent percentages of the 68.3-km-long segment of coast between Mansfield Channel and the Rio Grande are presented for each classification unit in Table 2. Eighty nine percent of this coastal segment is undeveloped, but where it is developed, the development is mostly moderate to high density (Table 2). Single-family homes, that were predominant in the 1950s and 1960s, represent less than 1% of the shore. Multi-family units, such as high-rise condominiums and hotels, represent 4% of the shore. Only 4% of the shore is classified as parks, which includes both state and county parks. About 50% of the shore has high continuous dunes and discontinuous dunes cover an additional 24% of the shore. Because the dunes are mainly continuous, complete overwash occurs only along 7% of the shore (Table 2). Eighty one percent of the shore is characterized by natural beaches more than 30 m wide; wide maintained beaches account for another 12% of the shore. Because the beaches are wide and mostly undeveloped, there is little need for shoreline stabilization structures. Only about 8% of the shore is influenced by hard structures (Table 2); the most extensive structures are walls built in the backbeach of South Padre Island to protect the condominiums and hotels.
|
| AccessibilityFOIAPrivacyPolicies and Notices | |
 |
|