Western Coastal and Marine Geology
1U.S. Geological Survey Pacific Science Center, Santa Cruz, Calif.
2NOAA National Ocean Service CO-OPS, Silver Spring, Md.
3Retired, formerly with NOAA National Ocean Service CO-OPS, Silver Spring, Md.
4Sea Surveyor, Inc., Benicia, Calif.
An acoustic hydrographic survey of South San Francisco Bay (South Bay) was conducted in 2005. Over 20 million soundings were collected within an area of approximately 250 sq km (97 sq mi) of the bay extending south of Coyote Point on the west shore, to the San Leandro marina on the east, including Coyote Creek and Ravenswood, Alviso, Artesian, and Mud Sloughs. This is the first survey of this scale that has been conducted in South Bay since the National Oceanic and Atmospheric Administration National Ocean Service (NOS) last surveyed the region in the early 1980s. Data from this survey will provide insight to changes in bay floor topography from the 1980s to 2005 and will also serve as essential baseline data for tracking changes that will occur as restoration of the South San Francisco Bay salt ponds progress. This report provides documentation on how the survey was conducted, an assessment of accuracy of the data, and distributes the sounding data with Federal Geographic Data Committee (FGDC) compliant metadata. Reports from NOS and Sea Surveyor, Inc., containing additional survey details are attached as appendices.
Download this report as a 113-page PDF document (of2007-1169.pdf; 18.2 MB)
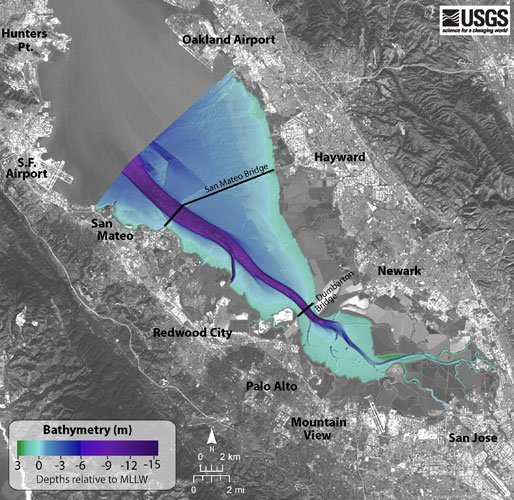
Figure 14 (above) of this report shows the sounding data gridded using the methods of Foxgrover, et al., (2004) and rendered as color-shaded bathymetric relief. This file was made from an uncompressed TIFF file. The PDF was made using Zip compression that is a non-data-loss compression method. The resulting file is large but of both high-resolution and high sharpness.
Download this figure as a TIFF file (fig14.tif; 6 MB)
Download this figure as a PowerPoint slide (fig14.ppt; 632 kB)
Download this figure as a 900-dpi, PDF poster, 33 x 29 inches (fig14.pdf; 22.2 MB)
This Open-File Report contains bathymetry data from the 2005 hydrographic survey of South San Francisco Bay, California. The soundings have been thinned to one meter spacing along tracklines and are organized by individual tidal zones (see Figure 13 from the report, below) with 100-m overlap between adjacent zones. With the exception of the far reaches of Coyote Creek, Mud Slough, and Alviso Slough (zones 51-54) that are only referenced to NAVD88, all of the soundings are available relative to both MLLW and NAVD88. The sounding data are provided in comma delimited XYZ (x-coordinate, y-coordinate, depth) format with the accompanying metadata files. The tidal zone boundaries are also available for download in the Environmental Sciences Research Institute’s (ESRI) shapefile format.
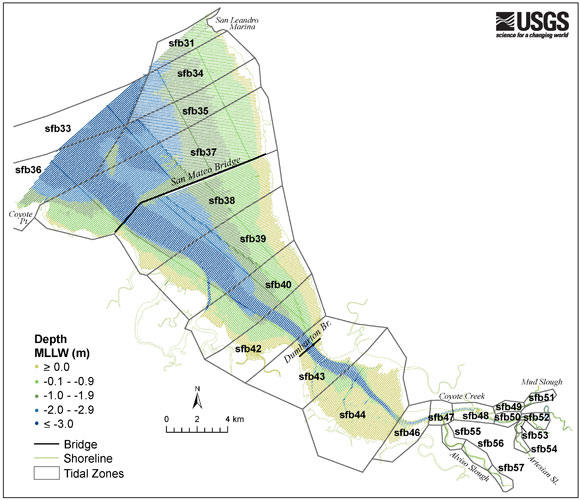
Figure 13. South Bay soundings available for download and partitioned based upon tidal zone boundaries. Zones not containing any soundings have been removed from the display. MLLW values have been approximated in far south sloughs (zones 51-54) shown above for display purposes only.
Download this figure as a TIFF file (fig13.tif; 1 MB)
| Region |
Downloadable File |
File Size |
Unzipped File Size |
|---|---|---|---|
| Entire Survey (NAVD88) | SSFB05_NAVD.zip | 23M | 91.8M |
| NAVD88 soundings partitioned by zone (see Figure 13 for reference) | |||
| SFB31 | SSFB05_NAVD88_z31.zip | 396K | 1.7M |
| SFB33 | SSFB05_NAVD88_z33.zip | 696K | 2.7M |
| SFB34 | SSFB05_NAVD88_z34.zip | 1.5M | 6.8M |
| SFB35 | SSFB05_NAVD88_z35.zip | 1.7M | 7M |
| SFB36 | SSFB05_NAVD88_z36.zip | 1.3M | 5M |
| SFB37 | SSFB05_NAVD88_z37.zip | 4.6M | 18.7M |
| SFB38 | SSFB05_NAVD88_z38.zip | 3.2 M | 12.3M |
| SFB39 | SSFB05_NAVD88_z39.zip | 2.6 M | 10.4M |
| SFB40 | SSFB05_NAVD88_z40.zip | 1.7 M | 6.7M |
| SFB42 | SSFB05_NAVD88_z42.zip | 1.3M | 5.1M |
| SFB43 | SSFB05_NAVD88_z43.zip | 823K | 3M |
| SFB44 | SSFB05_NAVD88_z44.zip | 1.8M | 7.2M |
| SFB46 | SSFB05_NAVD88_z46.zip | 172K | 668K |
| SFB47 | SSFB05_NAVD88_z47.zip | 80K | 289K |
| SFB48 | SSFB05_NAVD88_z48.zip | 69K | 247K |
| SFB49 | SSFB05_NAVD88_z49.zip | 21K | 74K |
| SFB50 | SSFB05_NAVD88_z50.zip | 34K | 124K |
| SFB51 | SSFB05_NAVD88_z51.zip | 17K | 63K |
| SFB52 | SSFB05_NAVD88_z52.zip | 57K | 214K |
| SFB53 | SSFB05_NAVD88_z53.zip | 16K | 56K |
| SFB54 | SSFB05_NAVD88_z54.zip | 24K | 86K |
| SFB55 | SSFB05_NAVD88_z55.zip | 45K | 164K |
| SFB56 | SSFB05_NAVD88_z56.zip | 39K | 142K |
| SFB57 | SSFB05_NAVD88_z57.zip | 20K | 73K |
| Upper Artesian Slough | SSFB05_NAVD88_art.zip | 5K | 17K |
| Upper Coyote Creek | SSFB05_NAVD88_coy.zip | 9K | 29K |
| Upper Mud Slough | SSFB05_NAVD88_mud.zip | 53K | 197K |
| QC Lines | SSFB05_NAVD88_QC.zip | 586K | 2.3M |
| NAVD88 Metadata | text, FAQ, html, xml | ||
| Tidal Zone Shapefile | SSFB05_zones.zip | ||
| Region |
Downloadable File |
File Size |
Unzipped File Size |
|---|---|---|---|
| Entire Survey (MLLW) | SSFB05_MLLW.zip | 22.9M | 91.1M |
| MMLW soundings partitioned by zone (see Figure 13 for reference) | |||
| SFB31 | SSFB05_MLLW_z31.zip | 396K | 1.7M |
| SFB33 | SSFB05_MLLW_z33.zip | 696K | 2.6M |
| SFB34 | SSFB05_MLLW_z34.zip | 1.5M | 6.8M |
| SFB35 | SSFB05_MLLW_z35.zip | 1.7M | 7M |
| SFB36 | SSFB05_MLLW_z36.zip | 1.3M | 5M |
| SFB37 | SSFB05_MLLW_z37.zip | 4.6M | 18.7M |
| SFB38 | SSFB05_MLLW_z38.zip | 3.2M | 12.4M |
| SFB39 | SSFB05_MLLW_z39.zip | 2.7M | 10.5M |
| SFB40 | SSFB05_MLLW_z40.zip | 1.7M | 6.7M |
| SFB42 | SSFB05_MLLW_z42.zip | 1.3M | 5.1M |
| SFB43 | SSFB05_MLLW_z43.zip | 824K | 3M |
| SFB44 | SSFB05_MLLW_z44.zip | 1.8M | 7.2M |
| SFB46 | SSFB05_MLLW_z46.zip | 172K | 668K |
| SFB47 | SSFB05_MLLW_z47.zip | 81K | 289K |
| SFB48 | SSFB05_MLLW_z48.zip | 69K | 247K |
| SFB49 | SSFB05_MLLW_z49.zip | 21K | 74K |
| SFB50 | SSFB05_MLLW_z50.zip | 34K | 124K |
| SFB55 | SSFB05_MLLW_z55.zip | 45K | 164K |
| SFB56 | SSFB05_MLLW_z56.zip | 39K | 142K |
| SFB57 | SSFB05_MLLW_z57.zip | 20K | 73K |
| QC Lines | SSFB05_MLLW_QC.zip | 586K | 2.3M |
| MLLW Metadata | text, FAQ, html, xml | ||
| Tidal Zone Metadata | text, FAQ, html, xml | ||
Download this report as a 113-page PDF document (of2007-1169.pdf; 18.2 MB)
Download South San Francisco Bay bathymetry map (Fig. 14) as a TIFF file (fig14.tif; 6 MB)
Download South San Francisco Bay bathymetry map (Fig. 14) as a PowerPoint slide (fig14.ppt; 632 kB)
Download South San Francisco Bay bathymetry map (Fig. 14) as a 900-dpi, PDF poster, 33 x 29 inches (fig14.pdf; 22.2 MB)
Download South San Francisco Bay map showing tidal zone boundaries (Fig. 13) as a TIFF file (fig13.tif; 1 MB)
For questions about the content of this report, contact Bruce Jaffe
Suggested citation and version history
|
|||||||

![]() U.S. Department of the Interior | U.S. Geological Survey
U.S. Department of the Interior | U.S. Geological Survey
URL: https://pubs.usgs.gov/of/2007/1169
Page Contact Information: Michael Diggles
Page Last Modified: July 5, 2007 (lzt, mfd)


